As cliché as it may sound, knowledge is, indeed, power! Equipping yourself with a thorough knowledge of the market you want to excel in is pivotal to your success. Therefore, we have brought you 15 critical Amazon seller statistics that can help you garner better results in terms of your revenue.
You can use these Amazon seller statistics to gain a competitive advantage over other market players. Curious to find out what these top 15 Amazon seller statistics are? Let’s jump right in!
Top 15 Amazon Seller Statistics
1. Amazon’s Yearly Revenue
According to Amazon’s report In 2025, the company’s net sales increased by 12% to $716.9 billion, up from $638.0 billion in 2024. Sales in North increased 10% YoY to $426.3 billion, whereas international sales increased 12% YoY to $161.9 billion.
2. Amazon US Market Share Is 37.6%
According to Statista, Amazon has the largest online retailer market share in the US, seizing 37.6% of the market. Amazon’s dominance in the market share is mirrored by its massive customer base, with an average of 2.7 billion monthly global visitors compared to Walmart’s 100 million visitors per month.
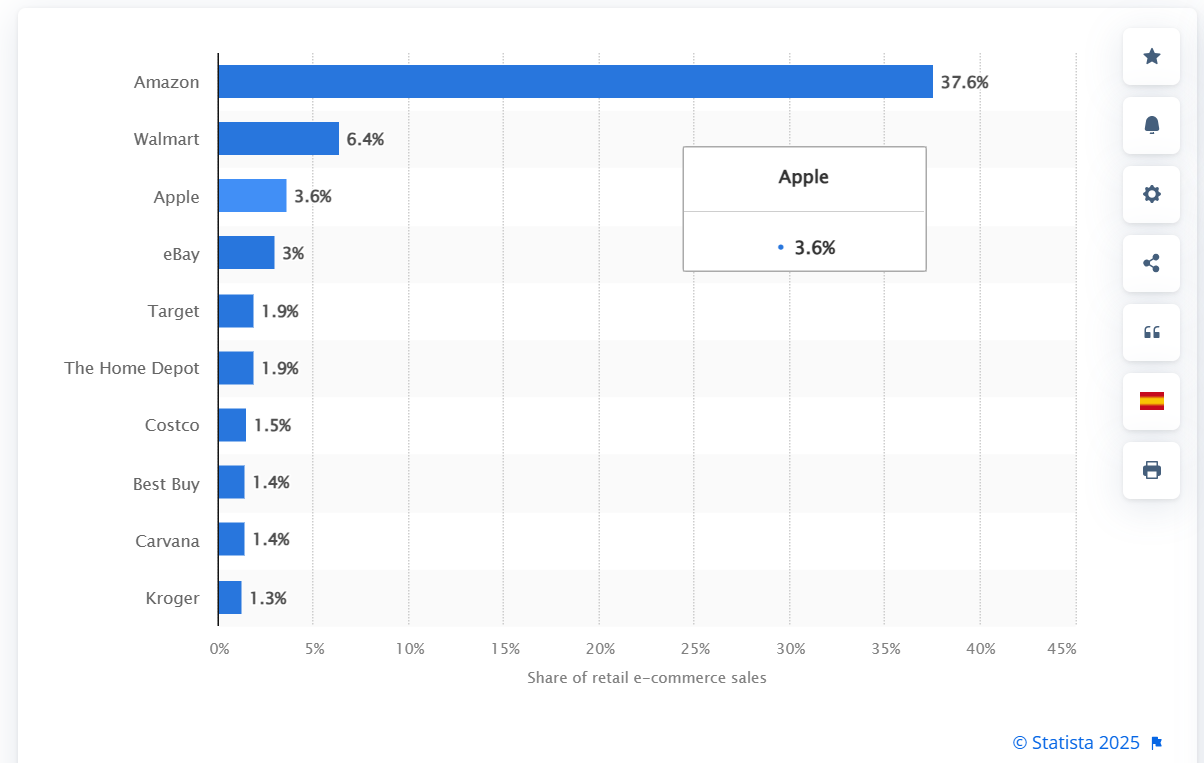
Source: Statista
3. Customers Use Rufus AI Assistant
More than 250 million customers used Rufus in 2025. Monthly average users have grown by 149%, and total interactions have increased by 210% year-over-year. Shoppers who engage with Rufus are over 60% more likely to complete a purchase during the same shopping session.
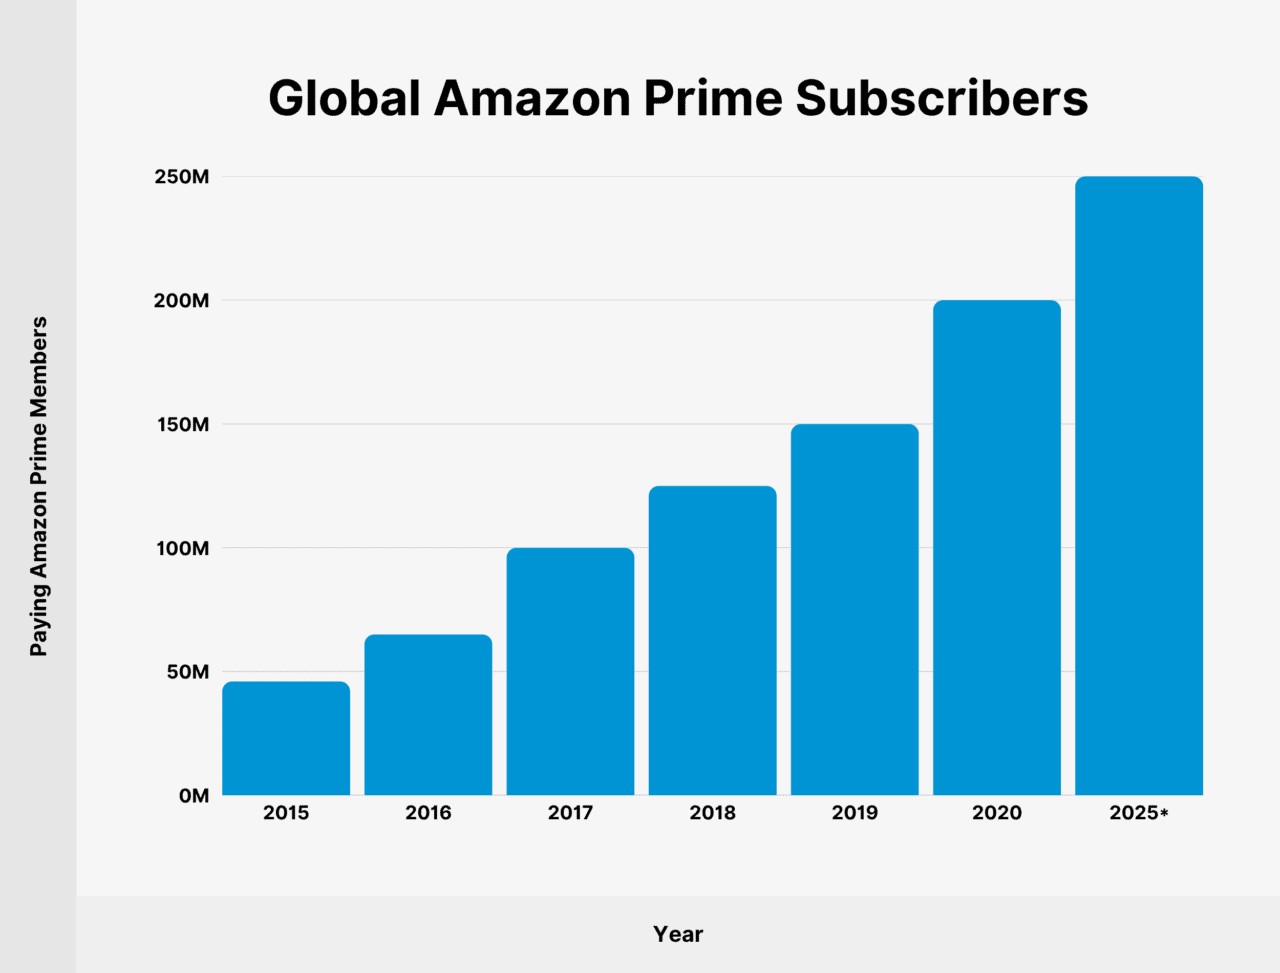
4. Number of Prime Members
According to Backlinko, US Amazon Prime surpassed 250 million members worldwide in 2026.
5. Spending of Prime Members
Generally, a prime member spends USD 1,000 a year compared to a non-prime member who typically spends between USD 100 and 500 a year on Amazon. It provides a compelling reason to make your products prime-eligible.
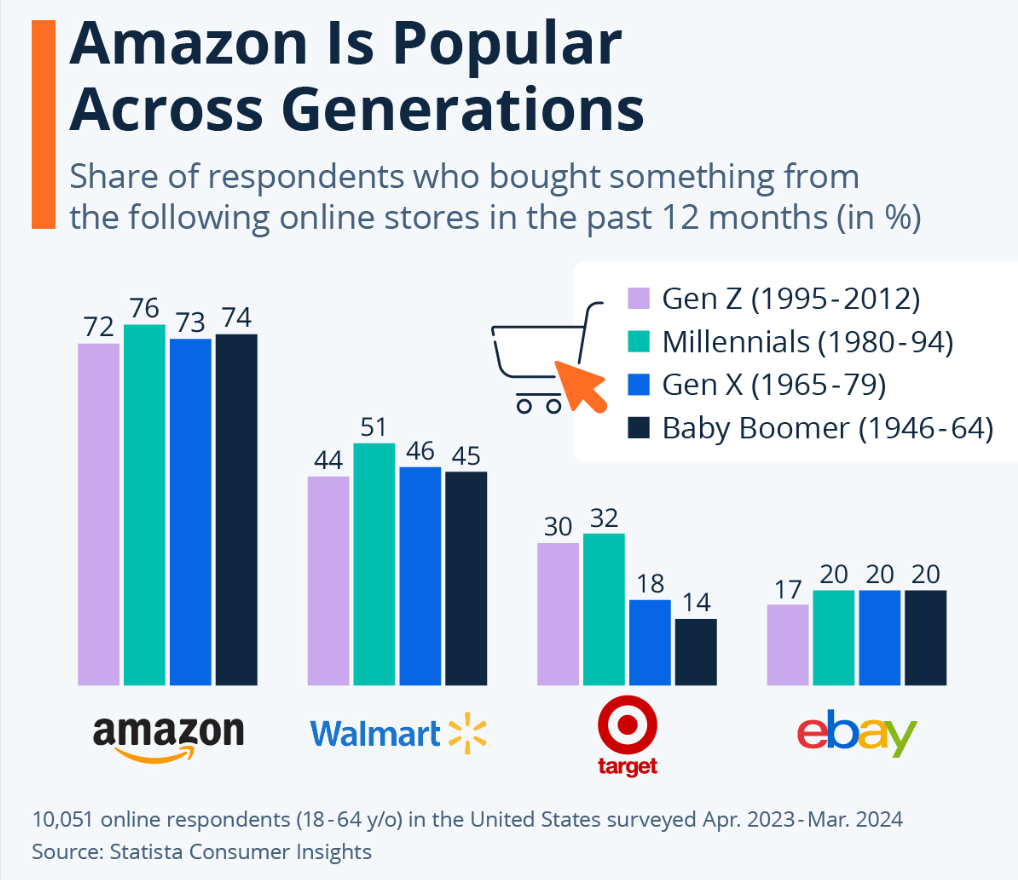
6. Amazon is Popular Across Generations
A Statista Consumer Insights survey highlights Amazon’s dominance in the US e-commerce market, showing consistent popularity across generations. Between 72% and 76% of respondents, spanning Gen Z to Baby Boomers, reported making a purchase on Amazon within the past 12 months.
7. Amazon’s Impact on Traditional Brick-and-Mortar Stores
Amazon is rapidly replacing the need for physical shops. Consumer behavior is rapidly shifting, and more people tend to shop from the comfort of their homes.
Take the home improvement industry, for instance. Amazon product statistics show that the website offers around 1.1 million items to choose from, which has caused a massive shift in people’s preferences.
8. Checking Prices on Amazon
Even those who do not tend to buy online visit Amazon to survey the market before going out to get what they need. According to PowerReviews, 50% of consumers start their product search on Amazon.
9. Prime Day Is the Most Profitable Event
It is not Cyber Monday or Black Friday that brings in the most incredible sales hikes. Instead, it is Prime Day, on which many users sign up for Prime membership and make significant purchases. According to Jungle Scout, Amazon e-commerce sales reached $24.1 billion in the US during the four-day Amazon Prime Day event in 2025. While Amazon’s 2025 Black Friday event generated at least $2 billion in online sales, according to Yahoo Finance.
Also Read: Top 10 Strategies to Supercharge Your Sales on Amazon Prime Day 2025
10. Is Alexa an Instant Buying Tool?
Alexa is not yet the instant buying tool that Amazon wants it to be. Since its introduction in 2015, around 50 million Amazon Echo devices have been sold.
Although people use Alexa to track their orders, only 2% of users place new orders. It indicates that people still prefer looking at and reading about the product they want to buy.
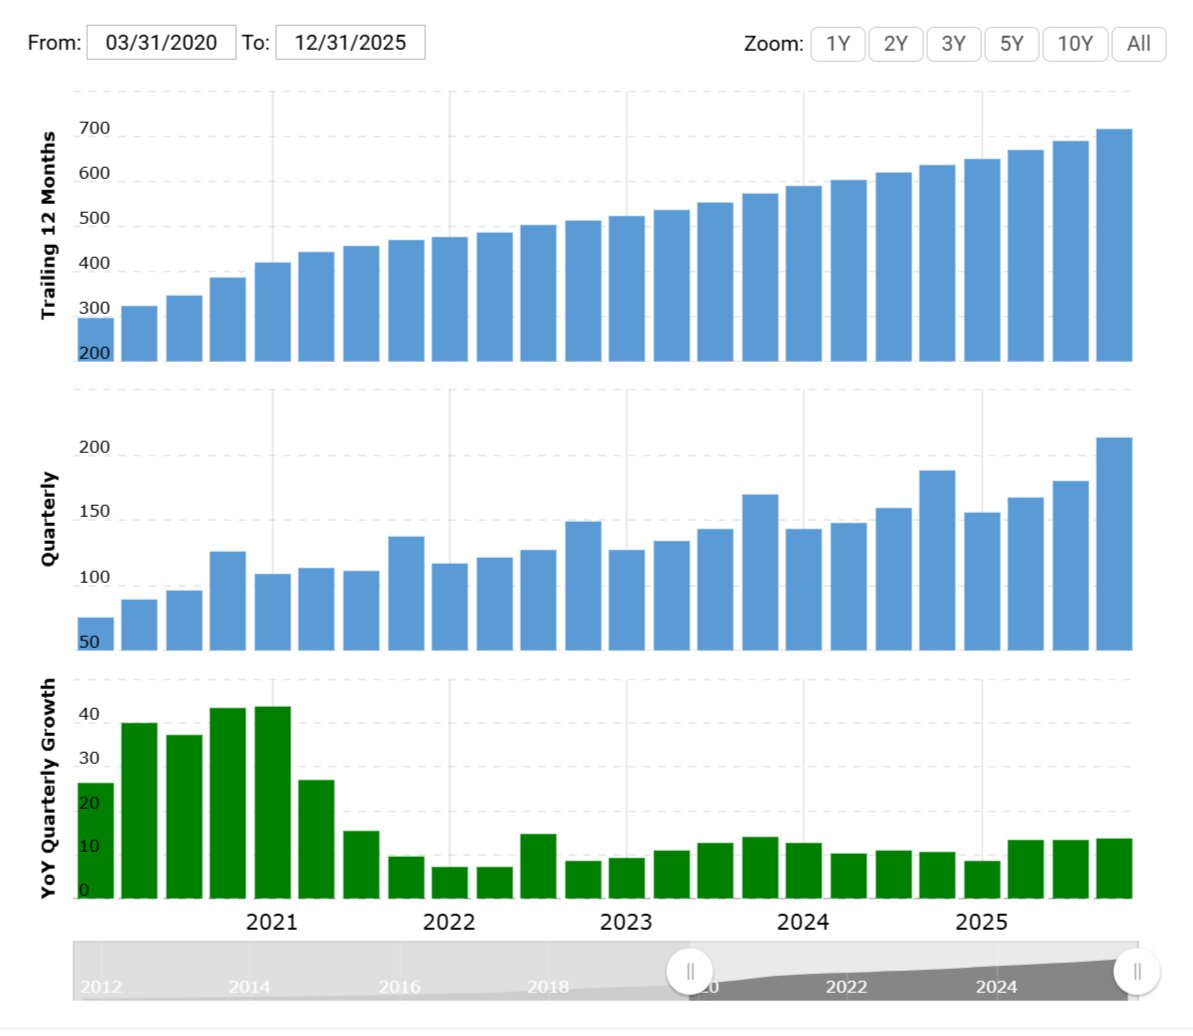
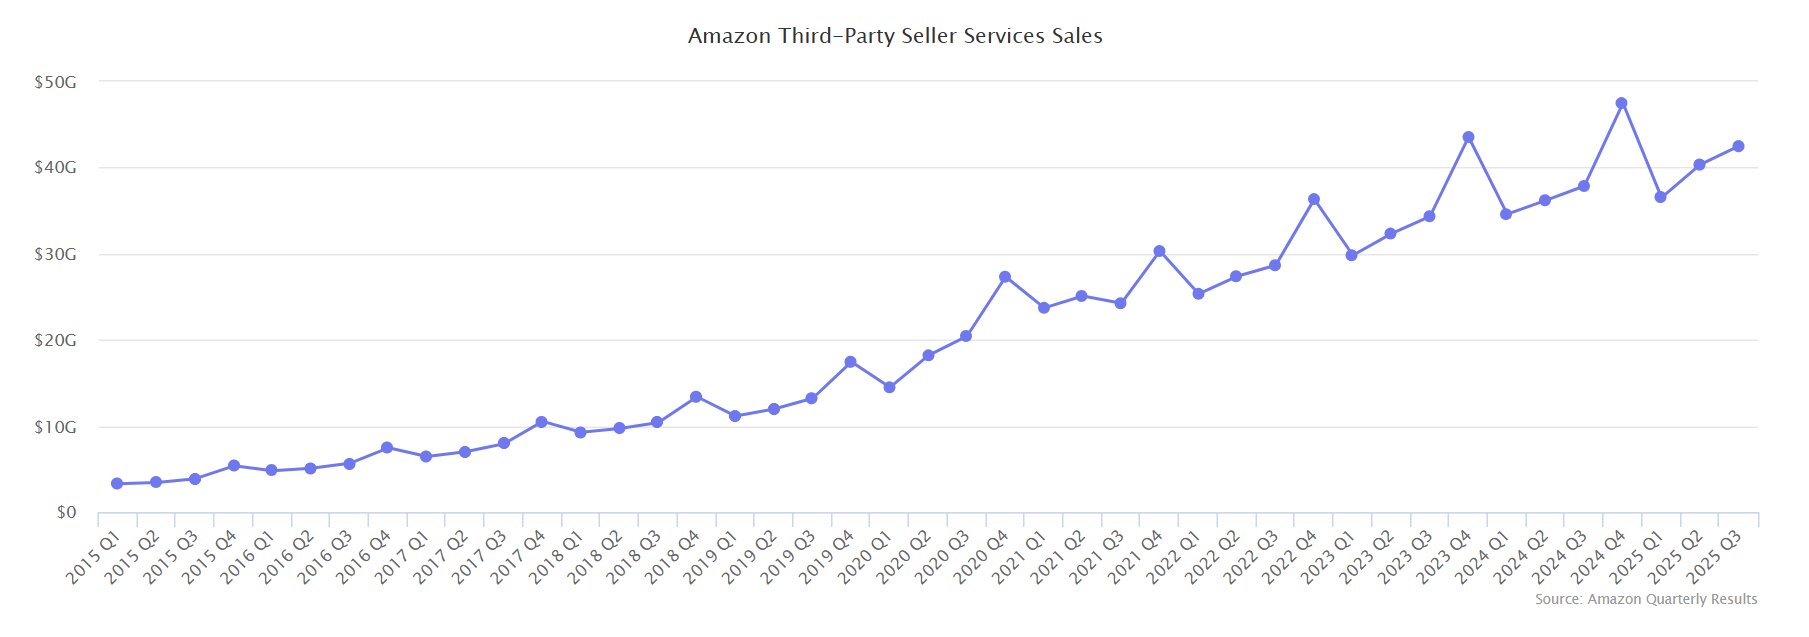
11. Third-Party Sellers Dominate on Amazon
According to Helium 10, more than 60% of Amazon marketplace sales in 2025 came from third-party sellers, most of which are small and medium-sized businesses. The third-party sales show a consistent upward trend with 2025 Q3 reaching $42.49 billion, a 12% YoY increase.
12. Per Minute Sales Count
Given that Amazon made $620.12 billion in revenue in 20224, its daily revenue stands at $1.7 billion, which means Amazon makes nearly $1.18 million every minute.
13. What Happens When Amazon Goes Down?
If Amazon’s website goes down even for a few minutes, the losses can be hundreds of thousands. In August of 2013, one such incident happened. The website went down for about 30 minutes. According to Forbes, it cost them around USD 2 million in lost revenue in such a short period.
On October 20, 2025, an AWS outage in the US-EAST-1 region occurred. It was caused by a DNS failure in DynamoDB, which disrupted Amazon’s marketplace, Prime Video, Alexa, Ring, internal systems, and other third-part sites. The hours-long incident affected over 3,500 companies across 60+ countries, resulting in significant operational disruption and unquantified revenue losses.
![]()
13. Amazon Item Sales Per Minute
Amazon does not release the exact number of items sold in 2025. According to AMZ Scout, US-based sellers sold more than 4.5 billion items in 2023, an average of 8,600 items every minute.
Also Read: Top Strategies to Improve Amazon Keyword Ranking and Drive Sales
14. Rising Number of Digital Buyers
As technology keeps evolving and continues to become better and better every day, consumer behavior keeps shifting accordingly. In 2016, the number of online buyers was estimated at around 1.66 billion.
As of 2025, the global number of online shoppers is estimated to be 2.77 billion. That means 33% of the world’s population is shopping online, marking a 2.2% increase from the previous year.
15. How Many Amazon Sellers Are There?
According to 2025 data, there are approximately 9.7 million registered sellers on Amazon globally, among which 1.9 million are active. In the US, roughly 1.11 million sellers are actively using the marketplace. So, if you’re thinking about how many people sell on Amazon, the answer is millions.
Final Thoughts
A better understanding of the marketplace you are using to sell your goods and services means a better business strategy. One of the best ways to keep yourself updated about Amazon is to keep looking out for the key Amazon seller statistics.
So, we have compiled this list in hopes of serving that very purpose. We hope it helped you develop better insights into the world of Amazon and take your business to a new height.