
Add up the conversions Google Ads, Meta, and Amazon each reported last month, then compare the total with the orders in your store. For most brands the platforms claim more sales than actually happened. That gap is a marketing attribution problem, and it decides where your next advertising dollar goes.
Marketing attribution models are the rules that decide which marketing touchpoints get credit for a sale. A shopper might see a social ad, click a search result, open an email, and then buy days later. Each model splits the credit for that order differently, and the model you use quietly shapes which channels look profitable.
Much of what is published on this topic is out of date. Many guides still teach models that Google removed from Google Ads and Google Analytics 4 in 2023, few mention the attribution window changes Meta made in 2026, and almost none cover what happens when part of the business runs through Amazon, where sales never reach your analytics.
This guide explains what marketing attribution is, why it matters, every main marketing attribution model with a worked example, which models are still available in Google’s tools, how attribution works on Google, Meta, and Amazon, how ecommerce brands should use it, and how attribution differs from incrementality testing and marketing mix modeling.
What Is Marketing Attribution?
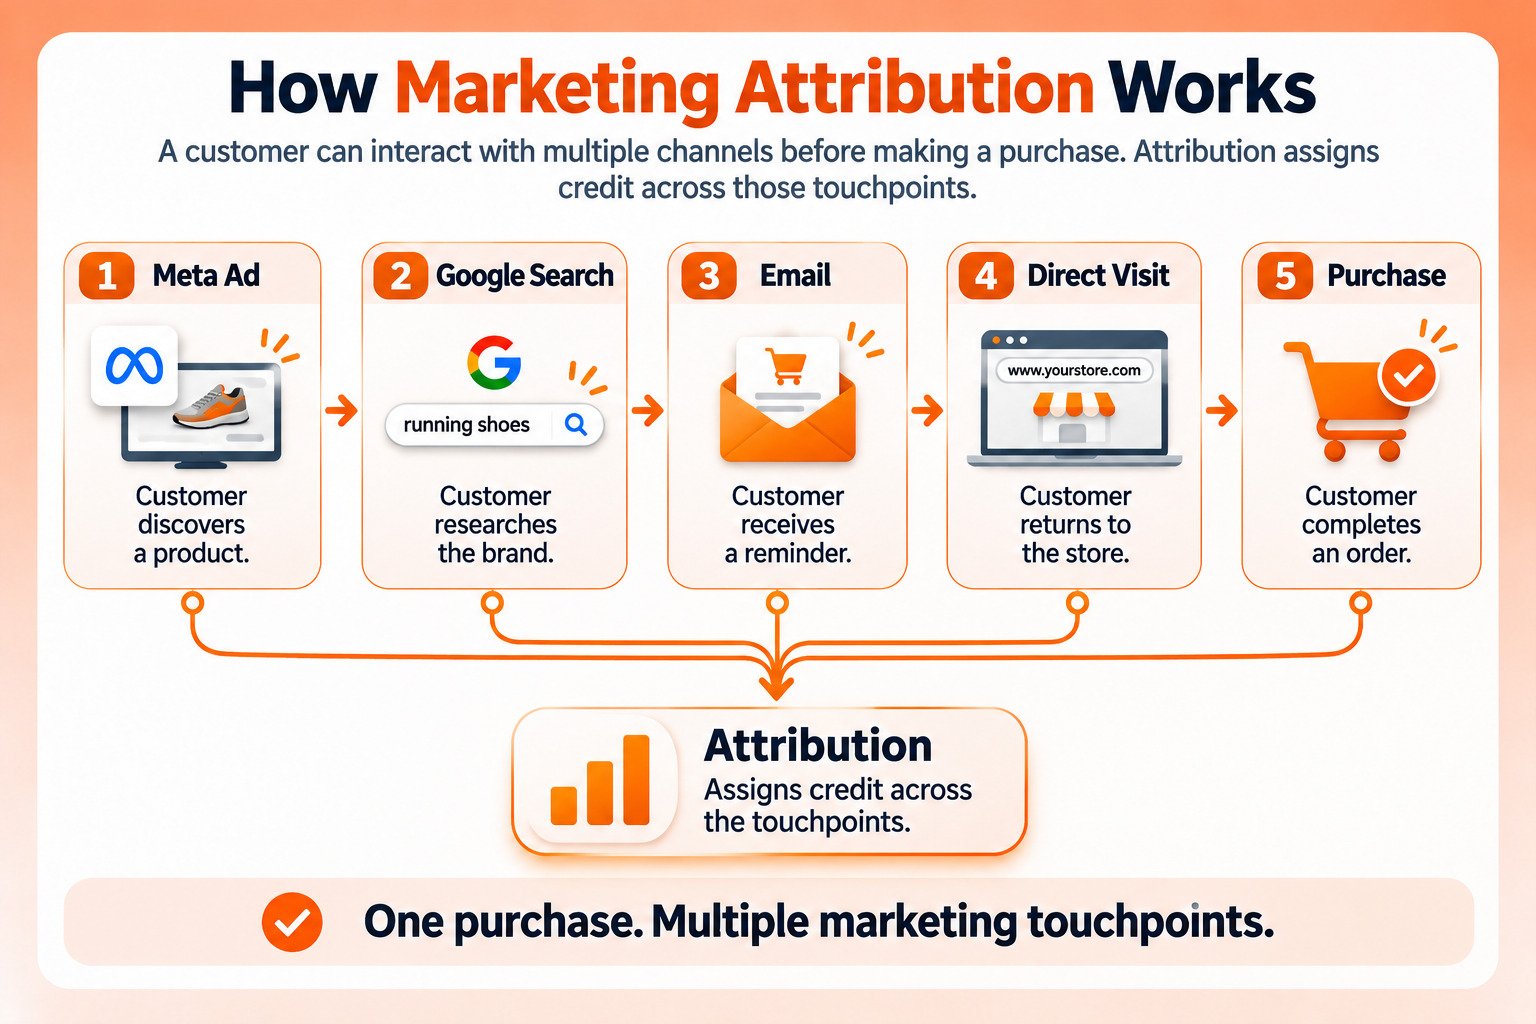
Marketing attribution is the process of identifying which marketing touchpoints contributed to a sale or conversion and assigning each one a share of the credit. It answers two questions: which channels moved a customer toward buying, and how much each one deserves for the result.
So what is attribution in marketing in practical terms? It turns a messy customer journey into a measurable record. Without it, the last thing a customer clicked usually gets all the credit by default, and every channel that came before it looks like wasted spend.
That is the core marketing attribution definition. Some teams call the practice attribution marketing, and when it is applied to a single campaign, it is often called marketing campaign attribution, but the idea is the same in each case.
There are two broad approaches. Single-touch attribution gives all the credit to one touchpoint, usually the first or the last. Multi-touch attribution spreads credit across several touchpoints according to a set of rules or a statistical model. Both are covered in detail below.
Attribution Tracking Definition
Attribution tracking is the technical layer that records each touchpoint so a model can assign credit. It relies on tags, pixels, UTM parameters, and click identifiers that log when someone sees or clicks an ad and what they do afterward. A model can only credit what the tracking captured, so gaps in tracking become gaps in attribution.
Why Is Attribution Important in Digital Marketing?
The short answer is that attribution shows which spend drives sales, so you can move budget toward the channels that work and away from the ones that don’t. Without it, decisions rest on whichever platform reports the most impressive numbers.
In practice, attribution helps with:
- Allocating budget between channels based on contribution rather than habit
- Spotting campaigns that spend heavily but rarely appear in a buying journey
- Understanding how customers move from discovery to purchase
- Giving fair credit to channels that start journeys but rarely get the final click
Understanding marketing attribution models and why they are important comes down to one fact: the same data can make a channel look essential under one model and useless under another. One limit is worth stating plainly. Attribution shows which touchpoints appeared along the path to a sale, not proof that any of them caused it. That distinction is covered later in this guide.
What Are the Main Marketing Attribution Models?
The main marketing attribution models are first-touch, last-touch, last non-direct click, linear, time decay, position-based, W-shaped, and data-driven attribution. The first three are single-touch models that give all credit to one interaction. The rest are multi-touch models that spread credit across the journey.
Single-Touch vs Multi-Touch Marketing Attribution
Single-touch models are simple and easy to explain, but they ignore everything except one moment in the journey. Multi-touch marketing attribution reflects how people actually shop, across several visits and channels, but it depends on accurate tracking and involves assumptions about how much each step is worth.
1. First-Touch Attribution
First-touch attribution gives 100 percent of the credit to the first interaction a customer had with your brand. It is useful for judging which channels bring in new people, but it ignores everything that happened between discovery and purchase.
2. Last-Touch Attribution
Last-touch attribution, often called last-click, gives all the credit to the final interaction before the purchase. It is simple and widely used, but it consistently overvalues channels that close sales, such as branded search, and undervalues channels that create demand.
3. Last Non-Direct Click Attribution
Last non-direct click attribution gives all the credit to the last interaction that was not a direct visit. If a customer clicked an email and then typed your web address to buy, the email gets the credit. It corrects one weakness of last-touch but keeps the rest.
4. Linear Attribution
Linear attribution splits credit equally across every touchpoint. A journey with four interactions gives each one 25 percent. It is fair in a simple way, but it treats a passing impression and a decisive click as equally important.
5. Time Decay Attribution
Time decay attribution gives more credit to touchpoints closer to the purchase and less to earlier ones. It suits short buying cycles and promotions, but it tends to undervalue the channels that introduced the customer in the first place.
6. Position-Based Attribution
Position-based attribution, also called U-shaped, gives 40 percent of the credit to the first touch, 40 percent to the last, and splits the remaining 20 percent across everything in between. It values both discovery and closing, with less weight on the middle of the journey.
7. W-Shaped Attribution
W-shaped attribution gives 30 percent each to three key moments, typically the first touch, the point where someone becomes a lead such as signing up for email, and the final touch, then splits the remaining 10 percent across other interactions. It suits brands with a clear sign-up step before purchase.
8. Data-Driven Attribution
Data-driven attribution uses your account’s own conversion data and a statistical model to estimate how much each touchpoint contributed. It adapts to real behavior rather than fixed rules, but it is less transparent, needs enough data to work well, and is calculated by the platform rather than by you.
| Model | How credit is split | Best for | Available in Google Ads and GA4? |
|---|---|---|---|
| First-touch | 100% to the first interaction | Judging which channels bring new customers | No, removed in 2023 |
| Last-touch | 100% to the final interaction | Simple reporting on what closes sales | Not exactly, since GA4 excludes direct visits |
| Last non-direct click | 100% to the last non-direct interaction | Reducing credit to direct visits | Yes, as GA4’s paid and organic last click |
| Linear | Equal across all interactions | A balanced view of long journeys | No, removed in 2023 |
| Time decay | More credit closer to purchase | Short buying cycles and promotions | No, removed in 2023 |
| Position-based | 40% first, 40% last, 20% middle | Valuing discovery and closing together | No, removed in 2023 |
| W-shaped | 30% first, 30% lead step, 30% last, 10% other | Journeys with a sign-up step | Not offered |
| Data-driven | Estimated from your own conversion data | Accounts with enough conversion volume | Yes |
Which Marketing Attribution Models Can You Still Use in Google Ads and GA4?
In Google Ads and Google Analytics 4, you can now use data-driven attribution and last-click attribution. Google removed first click, linear, time decay, and position-based models from both products in 2023, which means several models still described in many guides cannot be selected in Google’s own tools.
In Google Ads, the change came in two steps. Google removed the ability to select those four models from June 2023, then switched conversion actions still using them to data-driven attribution in September 2023, according to Google Ads Help. Data-driven attribution, last click, and external attribution were not affected.
In GA4, Google states that the four models “are no longer available as of November 2023,” per Google Analytics documentation. GA4 now offers three models: data-driven, paid and organic last click, and Google paid channels last click. Paid and organic last click is the same as last non-direct click, and Google states that all GA4 models exclude direct visits from credit unless a path is made up only of direct visits, per its model descriptions.
GA4 also lets you set how far back a touchpoint can be credited. For acquisition events such as a first visit, the default lookback window is 30 days and can be shortened to 7. For all other key events, the default is 90 days, with 30 or 60 days as alternatives.
If you want a linear or time decay view today, you need a third-party analytics tool or your own analysis outside Google’s interfaces. If you are reviewing how your current setup is configured, a Google Ads audit is a good place to start.
How Does Attribution in Advertising Work on Each Platform?
Advertising attribution works differently on every platform, because each ad network measures its own results with its own rules and windows. That is why Google, Meta, and Amazon rarely agree on how many sales your ads produced.
1. Google Ads
Google Ads credits conversions using data-driven or last-click attribution, as covered above. Campaigns that run across many placements, such as Performance Max campaigns, rely on this attribution to decide where to spend, which makes accurate conversion tracking especially important.
2. Meta
Meta Ads Manager offers three attribution models: standard, incremental, and custom. Under standard attribution, advertisers choose which interactions count, and Meta currently supports counting conversions within 1 or 7 days after a link click, 1 day after an ad view, and 1 day after other engagement such as a 5-second video play, according to Meta Business Help.
Two other details matter. Meta now offers incremental attribution, which optimizes toward conversions its models predict were caused by the ad. And Meta deprecated the 7-day view and 28-day view windows in its Ads Insights API on January 12, 2026, as announced in Meta’s developer update. Meta’s post covers the API and does not say whether Ads Manager reporting changed, so reporting tools that pull data through the API are the ones most likely affected.
These settings directly shape reported results, so they are worth reviewing before judging any Meta ads campaign.
3. Amazon
Amazon is a closed system. Sales that happen on Amazon never reach Google Analytics, so your website analytics cannot see them, and Amazon’s advertising reports only cover activity inside Amazon.
To measure off-Amazon marketing that sends shoppers to your listings, such as influencer campaigns or paid social, Amazon offers Amazon Attribution, a free measurement tool for brand-registered sellers, vendors, and the agencies that work with them in the US, Canada, the UK, Germany, France, Italy, and Spain. It reports detail page views, add-to-baskets, purchases, sales, and new-to-brand activity, and it uses a 14-day, last-touch model. For US sellers it also connects to the Brand Referral Bonus, which Amazon says averages 10 percent of product sales driven by non-Amazon marketing.
Inside Amazon, upper-funnel advertising has its own measurement layer, which we cover in our guide to the Amazon DSP funnel.
4. Why Platform Numbers Never Match Your Orders
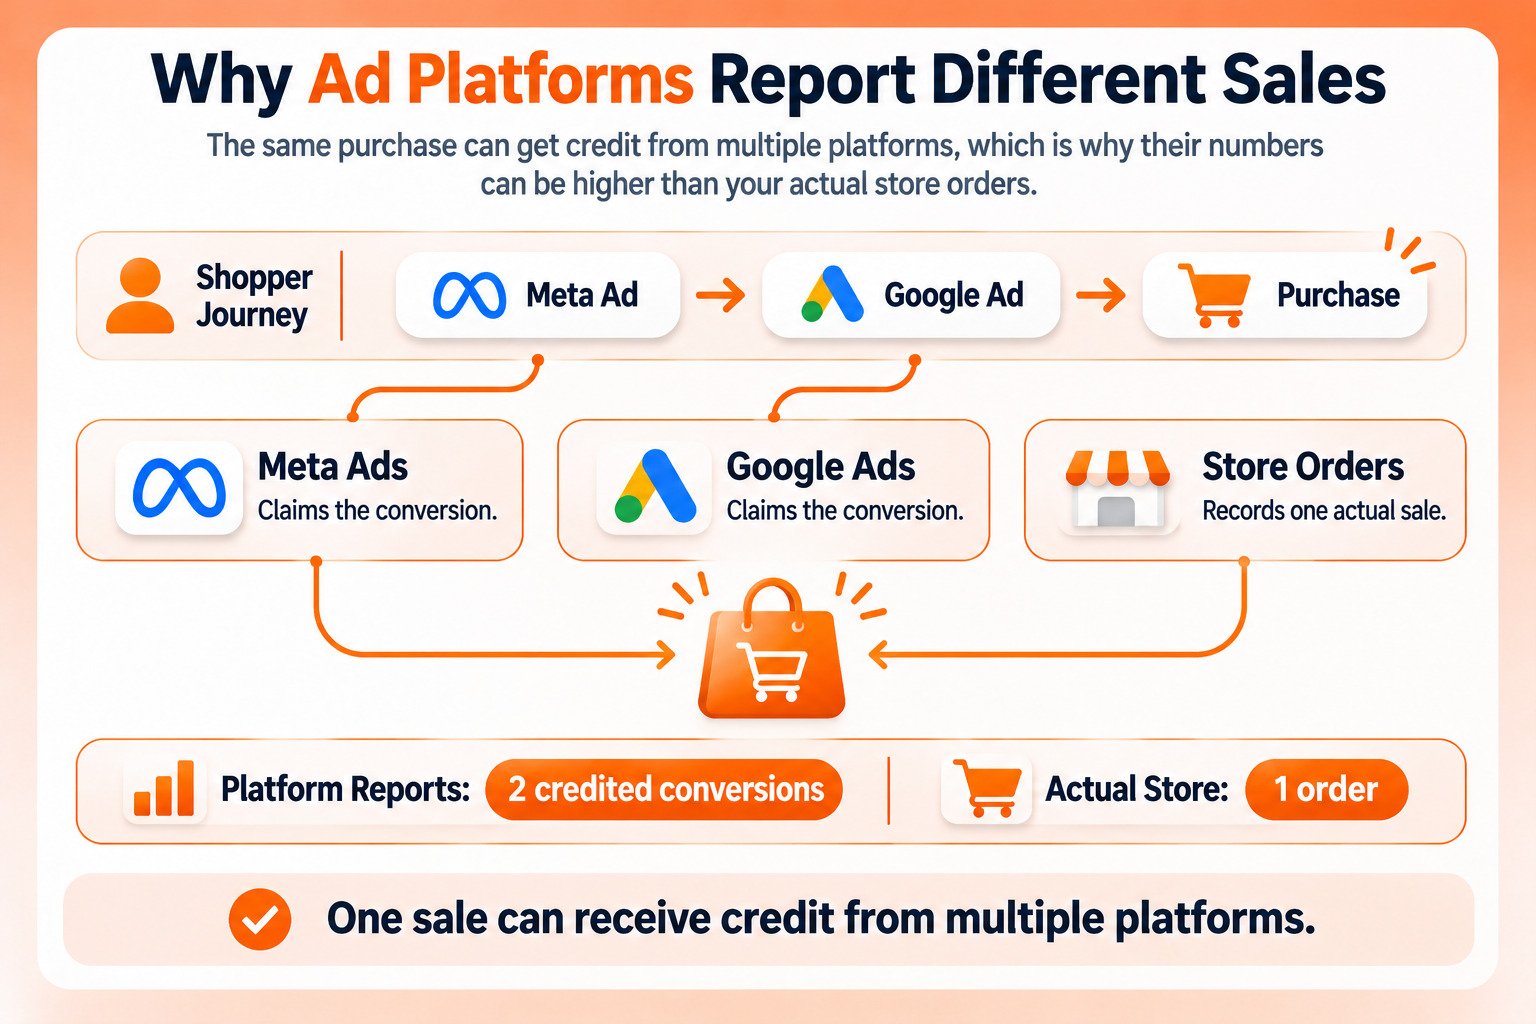
Each platform credits conversions using only its own data and its own window, and none of them can see the others. If a shopper clicked a Meta ad, then a Google ad, and then bought, both platforms can report that sale as theirs. Add the platform reports together and you count the same order twice.
Meta acknowledges a version of this problem within its own platform, warning that results cannot be compared across ad sets using different attribution models because each model counts differently. Across platforms, the effect is larger. Your store’s order data is the only figure that counts each sale exactly once.
What Do Marketing Attribution Models Look Like in Practice?
The clearest way to understand marketing attribution models is to run one order through all of them. Take a $120 order from a shopper whose journey had four touchpoints over seven days:
- Day 1: Clicked a Meta video ad and browsed the site
- Day 4: Clicked a non-brand Google search result and signed up for email
- Day 6: Clicked a promotional email
- Day 7: Typed the web address directly and bought
Here is how each model credits the same $120:
| Model | Meta ad | Google search | Direct visit | |
|---|---|---|---|---|
| First-touch | $120.00 | $0 | $0 | $0 |
| Last-touch | $0 | $0 | $0 | $120.00 |
| Last non-direct click | $0 | $0 | $120.00 | $0 |
| Linear | $30.00 | $30.00 | $30.00 | $30.00 |
| Time decay (7-day half-life) | $20.70 | $27.86 | $33.96 | $37.48 |
| Position-based | $48.00 | $12.00 | $12.00 | $48.00 |
| W-shaped (sign-up on Google visit) | $36.00 | $36.00 | $12.00 | $36.00 |
| Data-driven | Varies by account | Varies by account | Varies by account | Varies by account |
Two assumptions are worth stating. The time decay row halves a touchpoint’s weight for every seven days between it and the purchase. The W-shaped row treats the Google search visit as the lead step because that is when the shopper signed up for email. Data-driven attribution cannot be calculated by hand, because it depends on patterns in your own account.
One more detail changes the result in practice. GA4 excludes direct visits from credit in all of its models, so in GA4 this order would give the direct visit nothing, and its last-click report would credit the email, matching the last non-direct click row.
The same order makes the Meta ad look like either the entire reason for the sale or completely irrelevant, depending only on the model. That is why choosing a model is a business decision, not a reporting setting.
An Amazon and Website Journey
Now take a shopper who clicks a Google ad, browses your website, leaves, and buys the same product on Amazon two days later. Google Analytics records the website visit but no purchase. Amazon records the sale but not the Google click, unless that ad used an Amazon Attribution tag. No single tool sees the whole path, which is the normal situation for brands selling in both places.
Email often plays an assisting role in journeys like these, which is one reason it tends to be undervalued under last-touch reporting. Our guide to email marketing covers how to measure it as a sales channel.
How Should Ecommerce Brands Use Marketing Attribution?
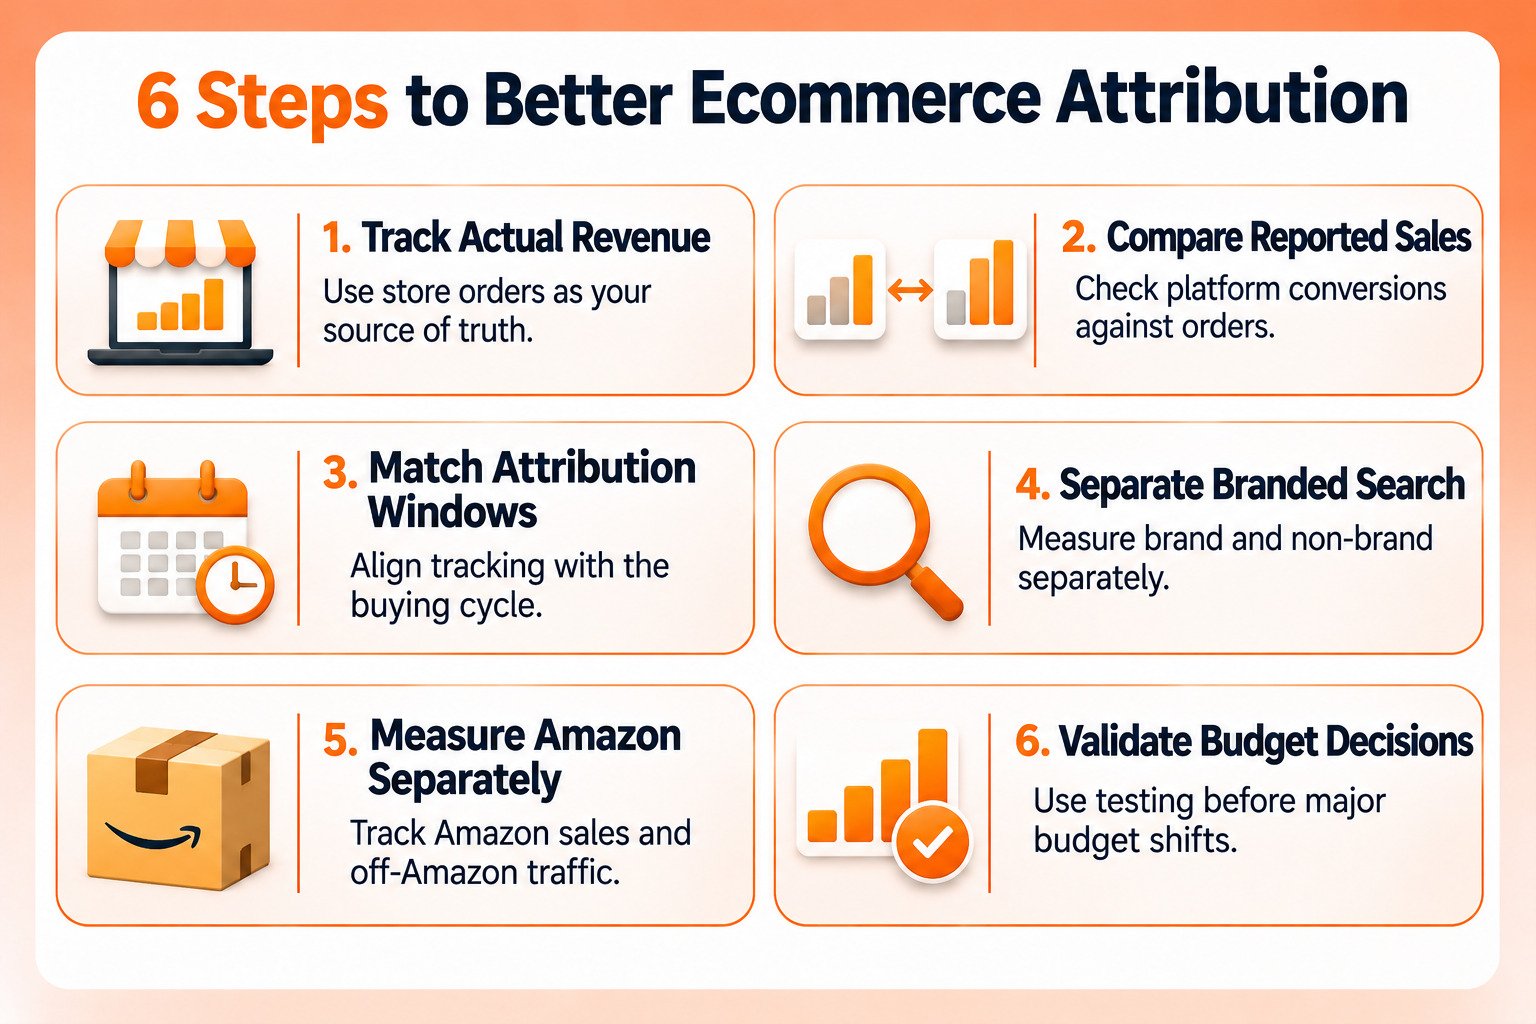
Ecommerce brands should use marketing attribution to compare channels and spot trends, and use their store’s order data as the source of truth for revenue. Attribution is a guide to where sales come from, not an exact ledger.
1. Choose One Source of Truth for Revenue
Decide that your store or order management system is the only place revenue is counted. Platform reports then become evidence about contribution rather than competing versions of the truth.
2. Compare Platform Conversions Against Actual Orders
Each month, total the conversions reported by every ad platform and compare that figure with your actual orders. The gap shows how much double counting your reporting contains, and whether it is growing.
3. Match Attribution Windows to Your Buying Cycle
A consumable bought on impulse and a piece of furniture researched for weeks need different windows. Set windows to reflect how long your customers actually take to decide, and use the same windows when comparing platforms.
4. Separate Brand and Non-Brand Credit
Branded search tends to collect demand credit that other channels created, because people search your name after seeing you elsewhere. Report branded and non-brand performance separately so brand campaigns do not make the whole program look stronger than it is.
5. Measure Amazon Separately
Treat Amazon as its own measurement system, use Amazon Attribution tags on any off-Amazon traffic you send there, and judge Amazon advertising with Amazon’s own reporting. Our guide to Amazon PPC metrics covers what to track inside the platform.
6. Use Attribution for Direction, Not Final Budget Decisions
Attribution is best at showing which way things are moving. Before making a large budget shift based on it, test the decision, which the next section explains. Understanding Amazon advertising costs alongside attribution data also helps keep budget changes grounded in margin.
What Is the Difference Between Attribution, Incrementality, and Marketing Mix Modeling?
Marketing measurement and attribution are not the same thing. Attribution assigns credit along the paths it can track. Incrementality testing measures how many sales would have happened without an ad. Marketing mix modeling estimates each channel’s impact from aggregate spend and sales over time.
| Method | Question it answers | Data it needs | Main limitation |
|---|---|---|---|
| Attribution | Which tracked touchpoints appeared before a sale? | User-level click and view data | Shows correlation, not cause, and misses untracked touches |
| Incrementality testing | How many sales did this ad actually cause? | A test group and a holdout group | Needs enough volume and runs one test at a time |
| Marketing mix modeling | How much does each channel contribute overall? | Months or years of spend and sales data | Less detailed, and slower to update |
Incrementality testing is the most direct check on attribution. Withhold an ad or channel from a randomly selected group, compare their purchases with everyone else’s, and the difference is what the ad actually produced. It often comes out lower than attributed results, because attribution also credits sales that would have happened anyway.
Marketing mix modeling has become more accessible. Google released open-source Meridian, its marketing mix model, to all marketers and data scientists on January 29, 2025. And with Meta now offering incremental attribution, the major platforms are clearly moving toward measuring cause rather than only credit.
The most reliable approach uses all three together: attribution for day-to-day direction, incrementality tests to check the biggest decisions, and marketing mix modeling for annual budget planning once there is enough history.
How Do You Choose a Marketing Attribution Model?
Choose a marketing attribution model by starting with what your tools actually offer, then matching the model to your sales cycle, channel mix, and the specific question you need answered.
1. Start With What Your Tools Actually Offer
The attribution modeling marketing teams can do inside Google Ads and GA4 is now limited to a choice between data-driven and last-click attribution. Other models require a separate analytics tool, so confirm what is available before designing reports around a model you cannot select.
2. Match the Model to Your Sales Cycle
Short, impulse-driven purchases suit models weighted toward the end of the journey. Longer, considered purchases suit models that give real credit to early discovery.
3. Match the Model to Your Channel Mix
Brands that rely heavily on social discovery, such as TikTok ads or Meta campaigns, will see those channels undervalued under last-touch. Brands that sell mostly through search may find last-touch reasonably accurate.
4. Decide Which Question You Are Answering
Marketing attribution modeling works best when the question is specific. First-touch answers where customers come from. Last-touch answers what closes sales. Data-driven estimates overall contribution. No single model answers every question.
5. Validate It Against a Holdout Test
Whatever attribution model marketing teams choose, they should test its biggest claims. If attribution says a channel drives a large share of revenue, a holdout test will show whether turning it off actually costs those sales.
Common Marketing Attribution Mistakes
- Adding platform-reported conversions together: Each platform claims the same sales, so the total overstates real revenue. Compare against store orders instead.
- Relying on a model Google no longer supports: First click, linear, time decay, and position-based attribution were removed from Google Ads and GA4 in 2023.
- Judging discovery channels on last-click: Channels that start journeys, such as organic social and video ads, rarely get the final click, so last-click reporting makes them look weaker than they are.
- Letting brand search take credit for other channels: People search your name after seeing you elsewhere, so branded search often collects credit for demand it did not create.
- Leaving Amazon out of the measurement plan: Amazon sales never reach your website analytics, so a plan that ignores Amazon misreads the whole business.
- Comparing platforms with different attribution windows: A 7-day click window and a 1-day click window produce very different numbers for the same campaign.
- Treating attribution as proof of cause: Attribution shows which touchpoints appeared before a sale. Only incrementality testing shows whether an ad caused it.
Measuring What Actually Drives Your Sales
Marketing attribution models are useful tools with real limits. They organize a complicated customer journey into something you can compare and act on, but every model makes assumptions, and every ad platform measures in its own favor.
The brands that measure well keep three habits. They treat store orders as the source of truth, use attribution to compare channels and spot direction, and test their largest budget decisions with holdout groups before committing. When Amazon is part of the business, they measure it as its own system rather than forcing it into website analytics.
Attribution will keep changing as platforms move toward modeled and incremental measurement. Building your reporting around actual orders and regular testing keeps your decisions sound regardless of which model each platform uses next.