
Too busy to read? Listen to this article instead.
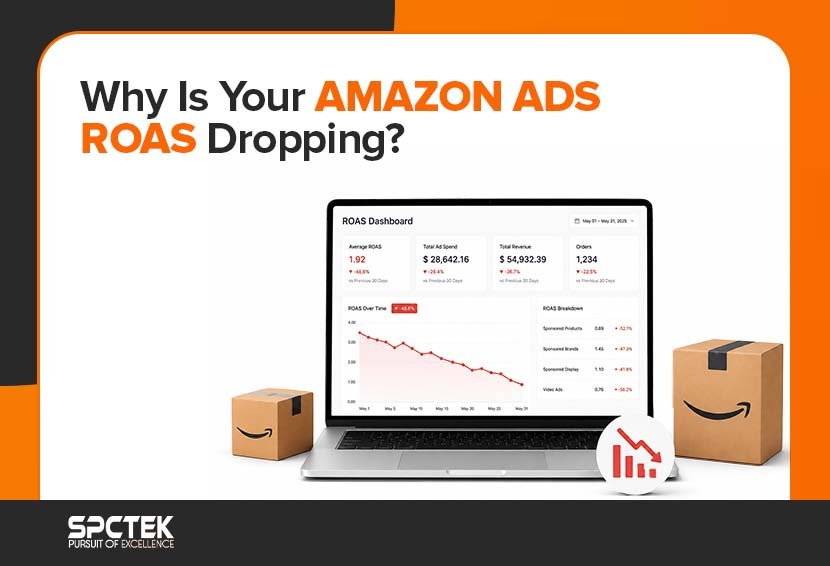
Your sales dashboard looks healthy. Revenue is up from last month, maybe even up from last year. So why does something feel off? If you check your Amazon ROAS closely, you might notice it has been sliding for weeks, and nobody caught it because everyone was watching the sales number instead.
This happens more often than most sellers realize, and it happens most to brands that have grown large enough to have a lot of campaigns running at once. A few losing campaigns can quietly drag your average Amazon ROAS down while your winning campaigns keep total sales climbing. This guide breaks down exactly why that happens, what a good ROAS on Amazon looks like, and the steps to find and fix the real cause before it costs you more.
What Is ROAS in Marketing?
ROAS stands for Return on Ad Spend. It tells you how much money you made in sales for every dollar you spent on ads. If you spend $100 on ads and those ads bring in $400 in sales, your ROAS is 4, or 4x.
People often mix up ROAS with ACoS, which is the opposite way of measuring the same thing. ACoS shows the percentage of sales spent on ads, while ROAS shows how many sales dollars each ad dollar brought back. A 25% ACoS and a 4x ROAS are describing the same performance, just from two different angles.
How to Calculate ROAS
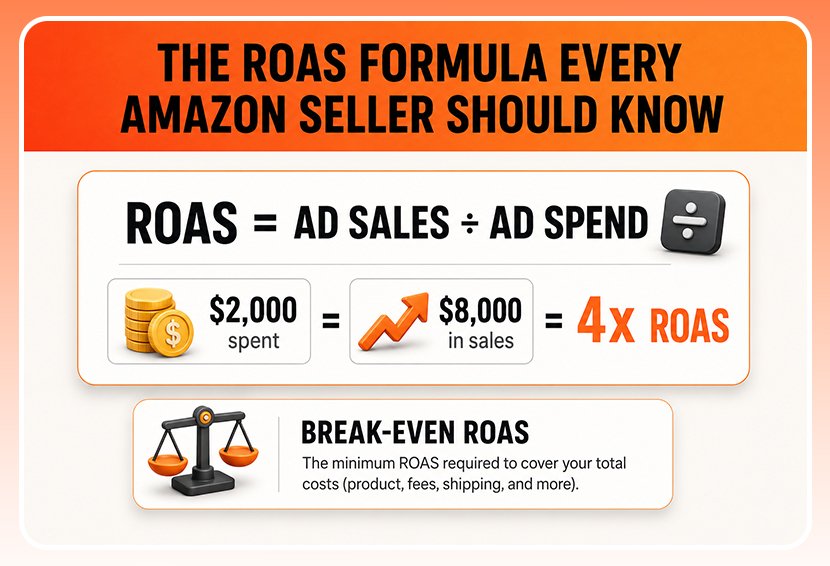
The Amazon ROAS formula is simple. Divide your total sales from ads by your total ad spend.
ROAS = Ad Sales ÷ Ad Spend
Say you spent $2,000 on Sponsored Products last week and those ads generated $8,000 in sales. Your ROAS is 4, meaning every $1 spent brought back $4.
But a raw ROAS number by itself does not tell you if you are actually making money. That is where break-even ROAS comes in. Break-even ROAS is the minimum ROAS you need just to cover your product cost and fulfillment fees, before you make a single dollar of profit. Most sellers never calculate this number, which means they often chase a ROAS target that has nothing to do with their actual margin. If your break-even ROAS is 3.2, then a “good-looking” ROAS of 3.5 is barely profitable, even though it might feel healthy on paper. Tracking your Amazon ROAS alongside the other Amazon PPC metrics every seller should track gives you the full picture instead of one number in isolation.
What Is a Good ROAS on Amazon?
There is no single number that works for every seller, because a good Amazon advertising ROAS depends heavily on your category and your margin. Based on data pulled from thousands of Amazon seller accounts, most healthy always-on campaigns fall between 3.0 and 5.0, with high-margin categories like beauty, supplements, and home decor often supporting a stronger ROAS of 5.0 to 8.0. New product launches and branded defense campaigns can run lower, sometimes as low as 2.0, and still make sense strategically since they are protecting long-term sales rank rather than chasing immediate profit.
The average Sponsored Products ROAS Amazon sellers see across the platform sits around 3.5x globally. If your account is well below that and your category is not an unusually tough one, that is worth investigating rather than accepting as normal.
Why Is Your Amazon ROAS Dropping Even When Sales Look Fine?
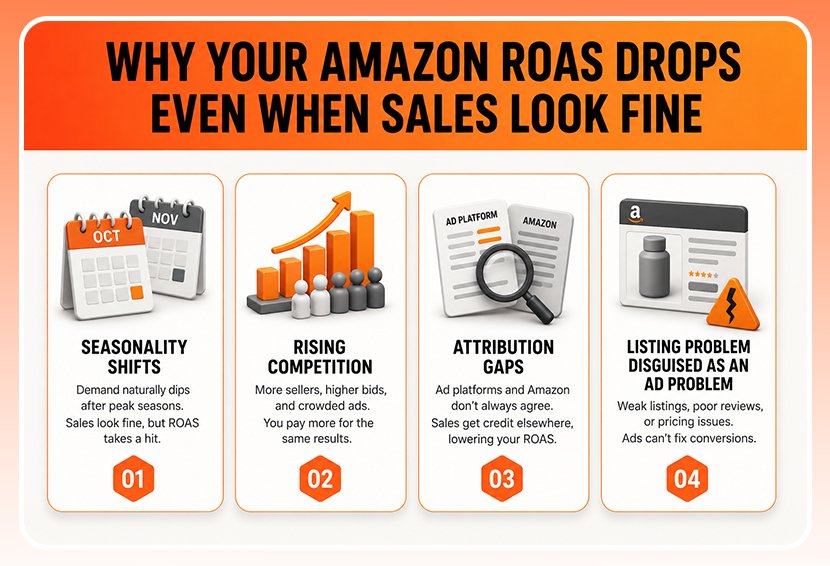
Once an account has enough campaigns and enough total sales volume, a real problem can hide in plain sight behind a growing top line. ROAS usually drops for four hidden reasons, including bad-month comparisons, rising competition, reporting gaps, or a listing problem disguised as an ad problem. Check the calendar and your numbers first before assuming something is broken. The real fix depends entirely on which one is actually happening.
1. Bad-Month Comparisons (Seasonality)
ROAS moves with the seasons, and this is the single most common false alarm sellers run into. Comparing this February to last November tells you nothing useful, since November naturally runs hotter with more shoppers actively buying. Always compare a month to the same month last year, not to whatever month came right before it. Pull your Amazon ROAS for the same calendar month across the last two or three years before you assume anything is actually broken. If this year’s number is close to last year’s for that same month, the “drop” you are seeing is just the calendar doing what it always does.
2. Rising Competition
Over 70% of sellers now run ads, up from around 40% just five years ago. That means more competition on the same search terms, and it means protecting your existing efficiency matters more than chasing raw growth.
As more sellers enter your category, more of them bid on the same keywords you rely on. This pushes up your cost per click even if you have changed nothing on your end, and it can also pull down your conversion rate as shoppers compare more options before buying. The way to confirm this is happening is to check your top keywords’ cost per click trend over the last three to six months. A steady climb across most of your keywords, not just one or two, usually means the whole category has gotten more expensive to compete in, and no amount of internal optimization on your side will fully undo that shift.
3. Reporting Gaps (Attribution Windows)
Amazon’s attribution window and reporting can differ from what actually lands in your account, and this gap grows more noticeable the more campaigns and products you run at once. Comparing your ad-attributed sales against the Amazon Attribution data and your actual bank deposits will tell you fast whether you are reacting to a real ROAS drop or a reporting mismatch that was never a real problem in the first place.
4. Listing Problems Disguised as Ad Problems
This one catches the most sellers off guard, and it is usually the hardest to catch because everything about the campaign itself looks fine. Your ad might be doing its job perfectly, earning clicks at a normal rate, while the listing itself is losing the sale once someone actually lands on it. If your click rate looks normal but your Amazon ROAS is still weak, the ad is not the problem. The listing is, and no amount of bid adjustment or keyword tweaking will fix a listing that is losing buyers after the click.
Why Are Amazon Ads Getting Clicks But No Sales?
If people are clicking your ad but not buying, the issue almost always sits on the listing itself, not the campaign. Amazon’s Search Query Performance report inside Brand Analytics can show you exactly where buyers are dropping off.
Start by checking your click rate against the category average. If it is close to normal, your ad and image are doing their job, and you should move on to checking your add-to-cart rate. A weak add-to-cart rate usually points to a listing content problem, unclear photos, a confusing title, or bullet points that do not answer the questions a buyer actually has. If add-to-cart looks fine but your purchase rate is still low, that usually comes down to price, reviews, or a shipping speed that is scaring buyers off at the last step. Several reasons your listing does not make sales on Amazon walks through each of these in more detail.
How to Improve ROAS on Amazon?
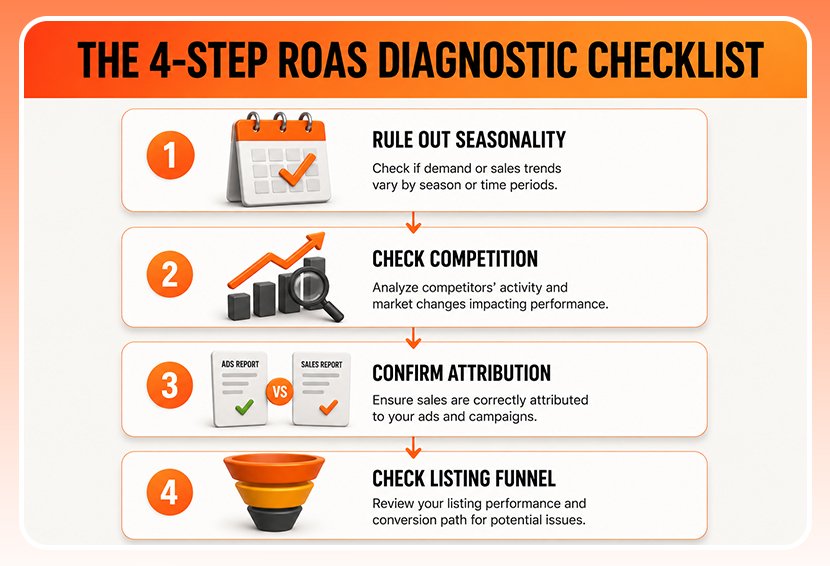
Once you know the real cause, improving your Amazon ROAS comes down to working through several checks in order. Check seasonality, category-wide cost increases, and attribution accuracy first, then the listing funnel, in that order. When tracking your Amazon ROAS performance, compare your own numbers from different periods.
1. Rule Out Seasonality
Pull your ROAS Amazon report for this month and compare it against the same month last year, not against last month. Amazon’s traffic and conversion rates shift with the calendar every year, so a February-to-November comparison will always look like a decline even when nothing is wrong. If this year’s number is close to last year’s for that same month, the drop is seasonal, and no campaign changes are needed. If it is meaningfully lower even against the same period last year, move to the next check.
2. Check Whether Competition has Increased in Your Category
Pull the cost per click for your top five to ten keywords over the last three to six months. A steady climb across most of them, not just one or two, usually means more sellers have entered your category and are bidding on the same terms. This is not something you fix by tweaking your own campaign; it is a market shift, and the right response is adjusting your bids and target Amazon advertising ROAS to reflect the new competitive reality rather than assuming something is broken on your end.
3. Confirm Your Attribution Numbers Match Your Actual Revenue
Compare what Amazon’s ad dashboard reports as attributed sales against what actually lands in your bank account for the same period. If there is a noticeable gap, you may be reacting to a reporting mismatch rather than a real drop in performance. Fixing this means adjusting how you read the ROAS number going forward, not launching new campaigns to chase a problem that was never really there.
4. Run the Listing Funnel Check
Pull your click rate, add-to-cart rate, and purchase rate for the affected ASINs and compare each one against your category average. If click rate is normal but add-to-cart or purchase rate is weak, the ad is doing its job, and the listing is losing the sale after the click. No amount of bid adjustment fixes this. You will keep spending more to get the same result until the listing itself gets fixed. Running the numbers back through the ROAS Amazon formula for just that ASIN, rather than your whole account, usually makes the gap obvious fast.
Finally, once the real cause is confirmed, rebuild your campaign structure around it. This might mean lowering PPC costs on underperforming keywords, fixing the top mistakes to avoid in your Amazon PPC campaigns that quietly drain budget, or working on how to dominate Amazon keyword rankings if the real issue is visibility rather than the ad itself.
Conclusion
A dropping ROAS rarely announces itself. Total sales can keep climbing for months while a real problem sits quietly underneath, covered by everything else in the account that’s still working. Most sellers only catch it once the gap has already cost them a meaningful amount, simply because nobody separated the ROAS Amazon number from the sales number long enough to notice the slide.
The fix isn’t complicated once the real cause is known. Rule out seasonality, check whether competition has driven up costs, confirm the attribution numbers actually match real revenue, then look at the listing funnel if the first three come back clean. Each step exists to stop time being wasted fixing something that was never broken in the first place. Our PPC and ad automation management is built to detect the wasted spend and create high-converting, revenue-focused campaigns.