
A store can grow sales every month and still run short of cash, often because money is sitting on warehouse shelves. The inventory turnover ratio shows how quickly the money you put into stock comes back as sales, which makes it one of the most useful numbers an ecommerce brand can track.
The simplest definition of inventory turnover ratio is the number of times you sell through your average stock in a given period. High inventory turnover means products move quickly, while a low figure means cash is tied up in goods still waiting for a buyer.
Most guides give one formula and a generic target range. Few explain that the two common formulas produce very different answers, that the standard average misleads seasonal sellers, or that a store-wide figure can hide products that have not sold in months. Amazon sellers also face storage fees that increasingly depend on how fast stock turns.
This guide explains the formula and its variations, how to calculate it step by step, three worked examples, what the result tells you, what a good ratio looks like, how turnover works on Amazon, how to improve it, and the mistakes that distort it.
What Is the Inventory Turnover Ratio?
The inventory turnover ratio is a measure of how many times a business sells and replaces its average inventory during a period, usually a year. It is calculated by dividing cost of goods sold by average inventory. The result shows how efficiently stock turns into sales and how long cash stays tied up in products.
That is the standard inventory turnover ratio definition used in accounting. In practice, the inventory turnover ratio meaning comes down to speed. A ratio of 4 means you sold through your average stock four times in the year, or roughly once every three months. Inventory turns, stock turn, and the rate of inventory turnover all describe the same measure, and when people ask what the inventory turnover ratio means, they usually want to know how long a product sits before someone buys it.
What Is the Inventory Turnover Ratio Formula?
The standard inventory turnover ratio formula is cost of goods sold divided by average inventory, with both numbers covering the same period and valued at cost. A second version divides net sales by average inventory, which produces a higher number because sales include your markup.
Inventory turnover ratio = Cost of goods sold ÷ Average inventory
You may also see it called the inventory turn ratio formula. The calculation is the same, and what changes between sources is the figure on top of the fraction and how average inventory is worked out.
1. The Cost of Goods Sold Formula
This is the version accountants use, and the one to rely on. Cost of goods sold is what you paid for the products you sold, and inventory on your balance sheet is recorded at cost, less any write-downs, so both sides of the fraction use the same basis.
2. The Sales-Based Formula
Some tools divide net sales by average inventory instead. Because sales are recorded at selling price and inventory at cost, the result is inflated by the ratio of your price to your cost. A brand that sells at double its landed cost will see a sales-based ratio twice as high as the cost-based figure. It is fine for a quick check, but never compare it with a cost-based number or a benchmark built on the other formula.
3. How to Calculate Average Inventory
The common shortcut adds inventory at the start and end of the period and divides by two.
That works when stock levels stay fairly steady.
Average Inventory = (Beginning Inventory + Ending Inventory) / 2
If stock rises and falls through the year, average the twelve month-end values for a more accurate picture.
Average Inventory = Sum of 12 Monthly Ending Inventories / 12
| Formula | What it uses | Effect on the result | When to use it |
|---|---|---|---|
| Cost of goods sold ÷ average inventory | Both figures at cost | Accurate, the accounting standard | Default choice for reporting and planning |
| Net sales ÷ average inventory | Sales at retail, inventory at cost | Overstated by the ratio of price to cost | Quick checks when cost data is missing |
| Two-point average inventory | Start and end of period | Distorted when stock levels swing | Stable, non-seasonal catalogs |
| Twelve-month average inventory | Each month-end value | Reflects seasonal build-ups | Seasonal and fast-growing brands |
The phrase inventory ratio sometimes refers to the inventory-to-sales ratio, which divides inventory by sales. It measures the same relationship in reverse, so a falling inventory-to-sales ratio usually moves with a rising turnover ratio. Check which one a report uses before comparing numbers.
How Do You Calculate Inventory Turnover Ratio?
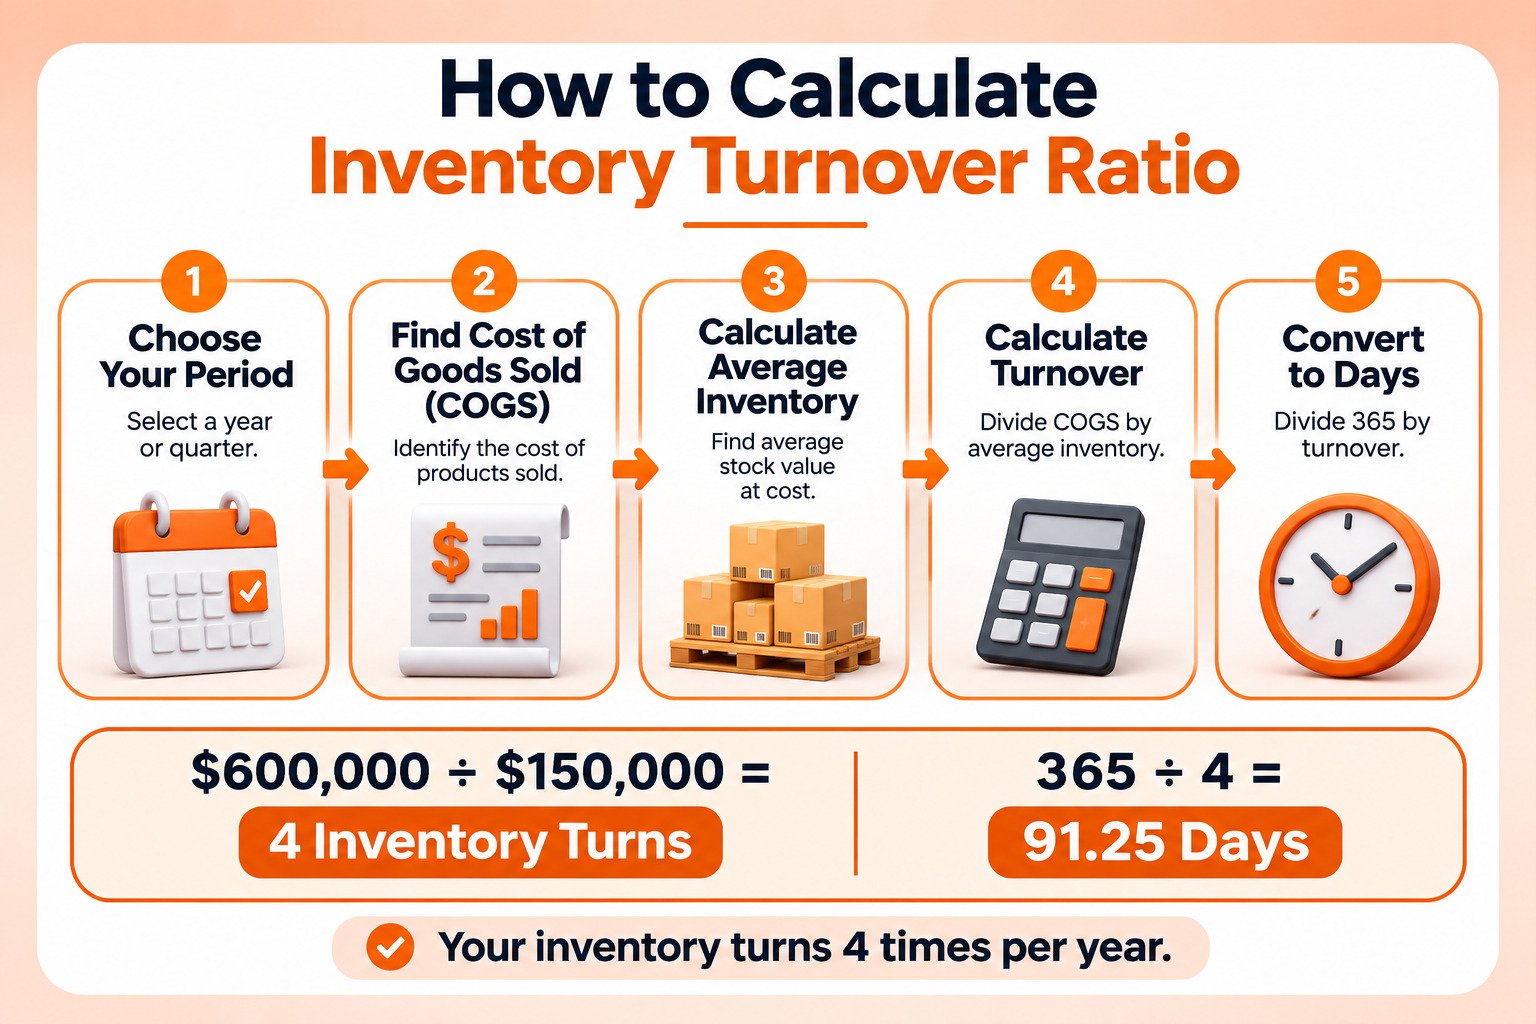
To work out how to calculate the inventory turnover ratio, pick a period, find cost of goods sold for it, calculate average inventory at cost for the same dates, and divide the first number by the second. Dividing 365 by the result shows how many days stock sits on average. Here is the inventory turnover calculation step by step.
1. Choose the Period
Most businesses use a full year, which smooths out seasonal swings. A quarter or a rolling 90 days works for tracking change, as long as you compare like with like.
2. Find Cost of Goods Sold for That Period
Take cost of goods sold from your profit and loss statement for exactly the same dates as your inventory figures.
3. Calculate Average Inventory
Value stock at cost, including units at Amazon, in your own warehouse, and with any third-party warehouse. Use month-end values if you build stock ahead of peak seasons.
4. Divide Cost of Goods Sold by Average Inventory
If cost of goods sold was $600,000 and average inventory was $150,000, you compute the inventory turnover ratio as 600,000 ÷ 150,000 = 4.
5. Convert It to Days of Inventory
Divide 365 by the ratio to get days of inventory, also called days sales of inventory. This tells you how long a product sits in stock, on average, before it sells. A ratio of 4 equals about 91.25 days (365 ÷ 4 = 91.25).
Days are easier to act on than the ratio, because you can compare them with your supplier lead time. If your supplier takes 60 days to deliver and you hold 91 days of stock, you have about a month of buffer.
What Does an Inventory Turnover Ratio Example Look Like?
A useful inventory turnover ratio example shows more than the arithmetic. Each of the three below uses numbers you can check by hand and shows a way the ratio can mislead.
One Store, Two Formulas
An online store had $1,200,000 in net sales and $600,000 in cost of goods sold last year. Inventory at cost was $140,000 on January 1 and $160,000 on December 31, so average inventory was $150,000.
| Formula | Calculation | Turnover | Days of inventory |
|---|---|---|---|
| Cost of goods sold | 600,000 ÷ 150,000 | 4.0 | About 91 |
| Net sales | 1,200,000 ÷ 150,000 | 8.0 | About 46 |
Switching formulas did not make the store twice as efficient. The sales-based figure is higher only because the store sells at double its cost.
Why Seasonal Sellers Get Misleading Results
A gift brand holds $50,000 of stock at cost on January 1 and $50,000 again on December 31. In between, it builds stock for the holiday season. Its month-end inventory, in thousands of dollars, runs 50, 50, 60, 60, 70, 80, 110, 160, 220, 250, 180, and 50 from January to December. Those twelve values add up to $1,340,000. Cost of goods sold for the year was $600,000.
| Method | Average inventory | Turnover | Days of inventory |
|---|---|---|---|
| Two-point average (January 1 and December 31) | $50,000 | 12.0 | About 30 |
| Twelve-month average | About $111,700 | About 5.4 | About 68 |
The shortcut uses only January 1 and December 31, the two leanest points of the year, so it misses the holiday build-up completely. It puts average inventory at $50,000 and says stock sits for about 30 days. In reality, the brand held more than $150,000 of stock from August to November, with a peak of $250,000 in October. Averaging all twelve months gives about $111,700, so stock actually sits for about 68 days, more than twice as long as the shortcut suggests. A brand that planned its cash around the shortcut would budget for $50,000 of stock and find it needed five times that at its October peak.
Why a Store-Wide Ratio Hides Dead Stock
Now split the first store’s $600,000 cost of goods sold and $150,000 average inventory across four products.
| Product | Cost of goods sold | Average inventory | Turnover | Days of inventory |
|---|---|---|---|---|
| Product A | $300,000 | $40,000 | 7.5 | About 49 |
| Product B | $200,000 | $30,000 | 6.7 | About 55 |
| Product C | $70,000 | $40,000 | 1.75 | About 209 |
| Product D | $30,000 | $40,000 | 0.75 | About 487 |
| Whole store | $600,000 | $150,000 | 4.0 | About 91 |
The store-wide ratio of 4 looks reasonable. Underneath it, Products C and D hold more than half the inventory value while producing about a sixth of cost of goods sold, and Product D would take well over a year to sell through. Product-level turnover is the version that leads to decisions.
What Does Inventory Turnover Ratio Tell You?
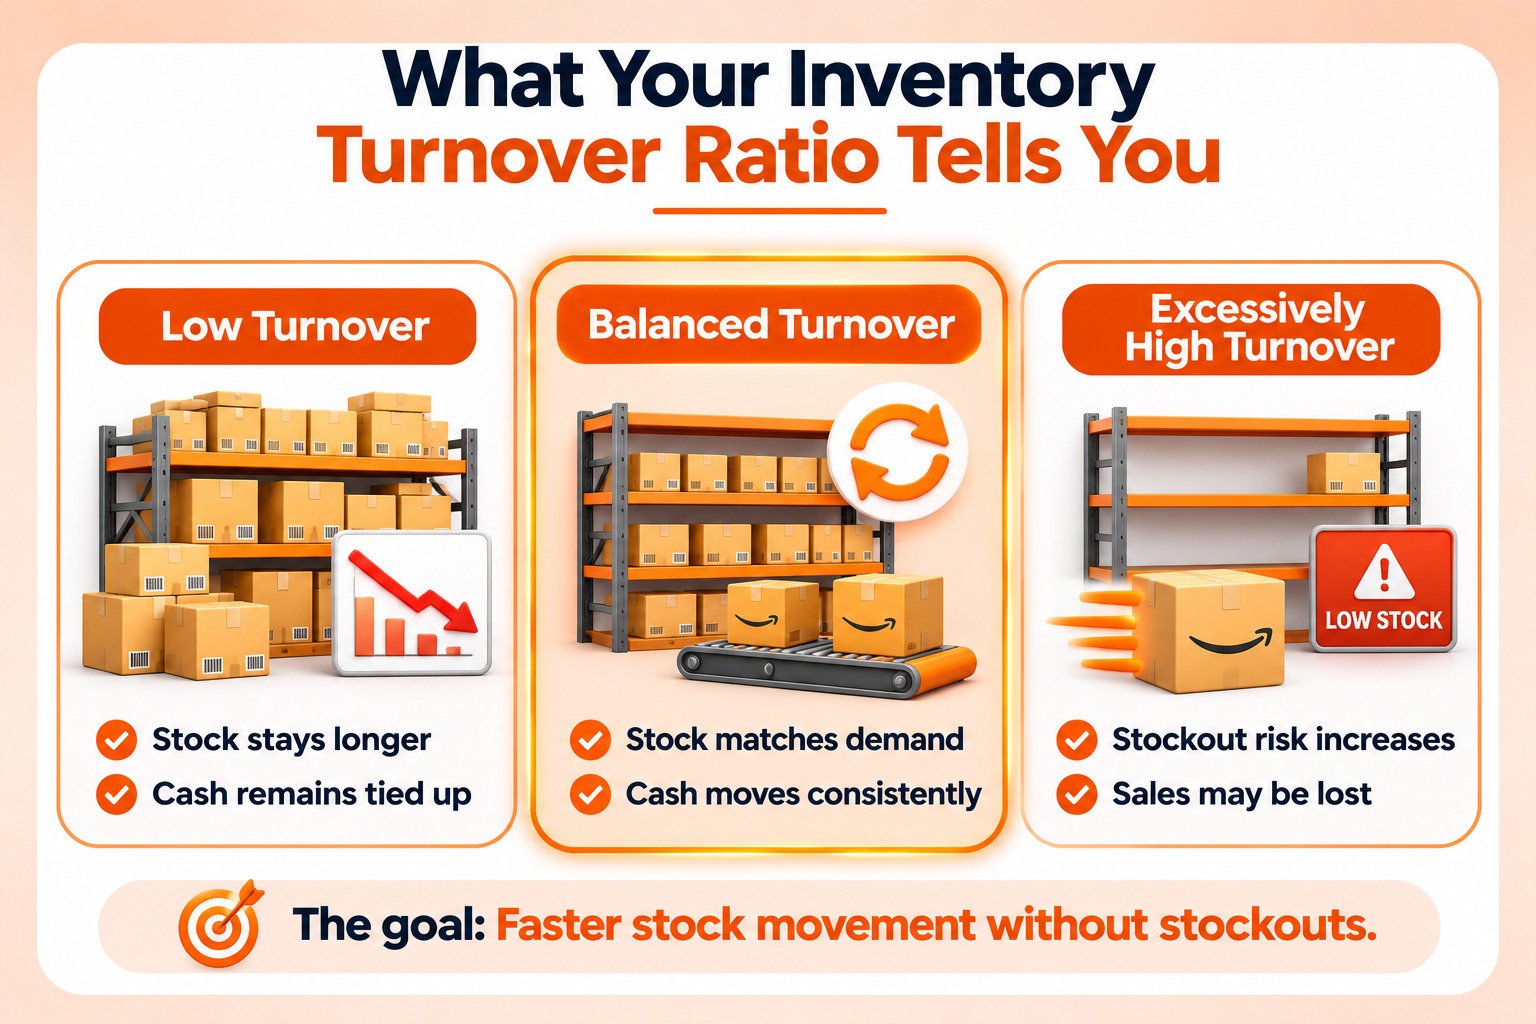
The inventory turnover ratio tells you how efficiently stock turns into sales and how long cash stays tied up in inventory. Tracked over time and by product, it shows whether demand keeps pace with purchasing and which products are quietly costing you storage and capital. Sound inventory turnover ratio interpretation always looks at what is driving the number.
What Does a Higher Inventory Turnover Ratio Mean?
A higher inventory turnover ratio means you are selling through stock more often, which usually points to strong demand, accurate buying, or both. Cash comes back faster and products have less time to go out of season. A rising ratio can also mean inventory was cut sharply while sales held steady, which can be smart or risky depending on how close you are to running out.
What Does a Lower Inventory Turnover Ratio Mean?
A lower ratio means stock sits longer before it sells. Common causes include over-ordering, falling demand, weak listings, uncompetitive pricing, or a few slow products dragging down the total. Sometimes it is deliberate, such as extra stock ahead of a long supplier lead time or a major sales event.
Can Turnover Be Too High?
Yes. When stock is so lean that best sellers run out, you lose sales, and on marketplaces you can also lose search ranking that takes time to rebuild. Frequent small orders can raise freight and per-unit costs as well. The goal is turnover fast enough to keep cash moving without leaving popular products out of stock.
What Is a Good Inventory Turnover Ratio?
There is no single good inventory turnover ratio for every business. The right number depends on category, margins, supplier lead times, and sales channels. A store selling laptops will usually turn stock faster than a dealer in high-end cars, which is why the Business Development Bank of Canada advises comparing turnover only within the same industry.
Ranges quoted online as ideal rarely cite a source or say which formula they used. The same store can score 4 or 8 depending on the formula, so a borrowed range can make a healthy business look poor. A better approach is to set your own target from three inputs:
- Your history: Compare each product with its own turnover for the same period last year, so seasonality cancels out.
- Your lead times: Stock has to cover the supplier lead time plus a safety buffer, which sets a practical ceiling on turnover.
- Your cash needs: Decide how much capital you can hold in stock, then work out the turnover that level of inventory requires.
Peak seasons need their own targets. Turnover falls while you build stock, so a Q4 prep plan should set inventory levels by product and month rather than one annual figure.
How Does Inventory Turnover Work on Amazon?
On Amazon, slow inventory turnover costs more than tied-up cash. Stock that sits in fulfillment centers attracts age-based storage charges, lowers sell-through, and uses capacity faster products need, while running out has its own costs. Amazon sellers need turnover that is fast without being so lean that best sellers go out of stock.
1. Sell-Through Rate and the Inventory Performance Index
Amazon uses sell-through rather than the accounting ratio. In its FBA Inventory guide, Amazon defines sell-through as units sold and delivered over the past 90 days divided by the average number of sellable units in its fulfillment centers. It counts units instead of dollars and covers only stock held at Amazon.
Sell-through also shapes the Inventory Performance Index, a score from 0 to 1,000. Amazon says the score is largely based on balancing units sold against units on hand, avoiding excess and aged inventory, fixing listing issues, and keeping popular products in stock. Items count as excess when you hold more than 90 days of supply. Our guide to raising your IPI score covers the factors in detail.
2. Aged Inventory Surcharges and the 2027 Storage Fee Change
Until January 31, 2027, Amazon charges an aged inventory surcharge, previously called the long-term storage fee, on top of the monthly storage fee for inventory stored 181 days or more. Age is calculated first-in, first out across Amazon’s network, so the units you sell are deducted from your oldest stock. The surcharge is assessed using a snapshot on the 15th of each month, and a removal or disposal order submitted by 11:59 p.m. Pacific time on the 14th avoids it.
Under its 2027 fee changes, Amazon will replace the monthly storage fee and the aged inventory surcharge with a single, age-based unified monthly storage fee from February 1, 2027, and drop the storage utilization surcharge. Amazon says fees will be flat or lower for inventory that turns in under six months and higher for aged inventory. Storage at Amazon Warehousing and Distribution also becomes age-based on March 1, 2027, with stock held more than 12 months charged at 2.5 times the standard rate. Our post on managing aged FBA inventory covers ways to clear stock before it ages.
3. Storage Capacity Limits
Amazon sets a monthly limit on how much inventory each seller can send to and store in its fulfillment centers. When it announced the current capacity limits in January 2023, Amazon said they are measured in cubic feet and influenced by your IPI score, sales forecasts, shipment lead times, and fulfillment center capacity. Slow stock takes up space your best sellers need and can pull down the score that helps set future limits.
4. Why Running Out of Stock Costs More on Amazon
On Amazon, a stockout costs more than missed sales, because a listing that is out of stock stops building sales history and can lose ground to competitors. Amazon also charges a low-inventory-level fee when inventory is consistently low compared with customer demand. From February 1, 2027, that fee will apply only when inventory falls below 28 days of supply, based on actual shipments in the four weeks before and after the assessment date.
5. Measuring Turnover Separately for Amazon and Your Own Store
If you sell on Amazon and your own website, calculate turnover for each stock pool. A product can move quickly through FBA while the same item sits for months in the warehouse that supplies your website, and a blended figure hides that gap.
How Do You Improve Inventory Turnover Ratio?
You improve inventory turnover ratio by buying closer to real demand, clearing slow stock before it ages, and shortening the time between ordering and selling. The most effective changes happen at product level, where you can see which items earn their space and which ones drag down the total.
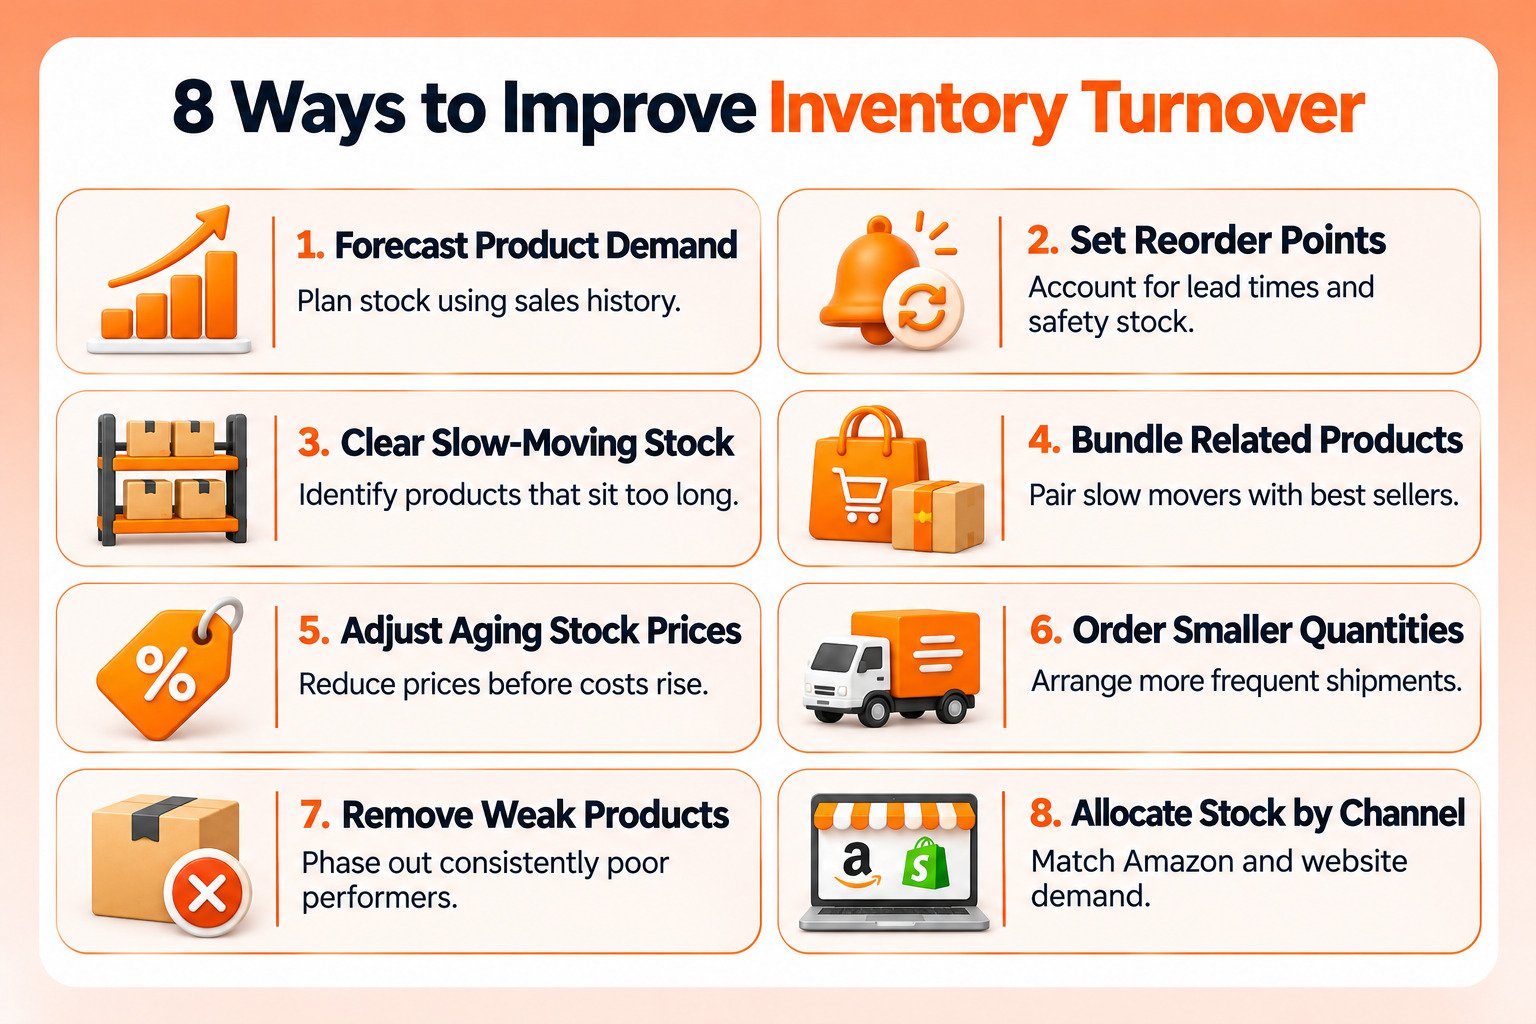
1. Forecast Demand by Product, Not Store-Wide
Forecast each product, or each variation where sizes and colors sell at different speeds. Use at least a year of history so seasonal peaks show, and adjust for planned promotions.
2. Set Reorder Points From Supplier Lead Times
Set each reorder point at your daily sales rate multiplied by the supplier lead time, plus a safety buffer. This replaces the habit of placing large orders whenever stock feels low.
3. Identify and Clear Slow-Moving Stock
Run a product-level turnover report monthly and flag anything well above your days-of-inventory target. For FBA stock, Amazon’s FBA Inventory tool filters units by time in the fulfillment center and shows which products will face the aged inventory surcharge within 60 days. Our guide to Amazon inventory reports explains how to use them.
4. Bundle Slow Movers With Best Sellers
Pairing a slow product with a popular one moves stock without heavy discounting, especially when the products are used together, such as a refill pack with its starter kit.
5. Adjust Pricing on Aging Stock Before Fees Build Up
A modest price cut early is usually cheaper than a deep discount later. On Amazon, an Outlet deal can clear older stock at a minimum 20% discount, and aged inventory will cost more to store under the 2027 fee structure. Compare the cost of a markdown with the storage and removal costs you would otherwise pay.
6. Negotiate Smaller, More Frequent Orders
Large orders earn better unit prices but lift average inventory. Ask suppliers about splitting annual volumes into scheduled shipments, since a small increase in unit cost can be worth the cash it frees.
7. Cut Products That Never Earn Their Shelf Space
If a product has low turnover, thin margin, and no strategic role in your catalog, phasing it out improves turnover for the whole business.
8. Allocate Stock by Channel
Split purchase orders between Amazon and your own warehouse based on each channel’s sales rate, and review the split as demand shifts. Our inventory management strategies guide covers allocation and replenishment in more depth.
Common Inventory Turnover Ratio Mistakes
Most problems with the inventory turnover ratio come from how it is calculated or read. These are the ones we see most often.
- Mixing the sales-based and cost-based formulas: Comparing a sales-based ratio with a cost-based target flatters performance. Pick one formula and use it everywhere.
- Using a two-point average for a seasonal business: Lean start and end dates hide the peak-season build-up. Average the month-end values instead.
- Judging the whole catalog by one number: A healthy total can hide products that have not moved in months. Track turnover by product.
- Chasing a published benchmark: Ranges found online rarely state their formula or source. Set targets from your own history, lead times, and cash needs.
- Treating higher turnover as always better: Turnover that is too high causes stockouts and, on Amazon, lost ranking. Aim for a range.
- Ignoring Amazon’s age-based storage costs: Slow FBA stock raises storage costs and uses capacity. Include those costs when deciding whether to discount or remove it.
- Calculating turnover once a year: An annual figure arrives too late to act on. Review it monthly by product.
Keeping Your Inventory Moving
The inventory turnover ratio is simple to calculate and easy to misread. Use cost of goods sold, average inventory across the whole year when stock is seasonal, and look at each product separately. Those habits turn a single accounting figure into clear decisions about what to reorder, discount, or drop.
For Amazon sellers, the stakes are rising. Slow stock costs fees and capacity, running out costs sales and search position, and from 2027 Amazon’s storage pricing ties cost directly to inventory age.
SPCTEK works with ecommerce brands to audit FBA inventory, forecast demand by product, and plan replenishment around lead times and peak seasons. If your cash is tied up in stock that is not moving, our inventory forecasting service starts with a clear view of where it is sitting.