
Too busy to read? Listen to this article instead.
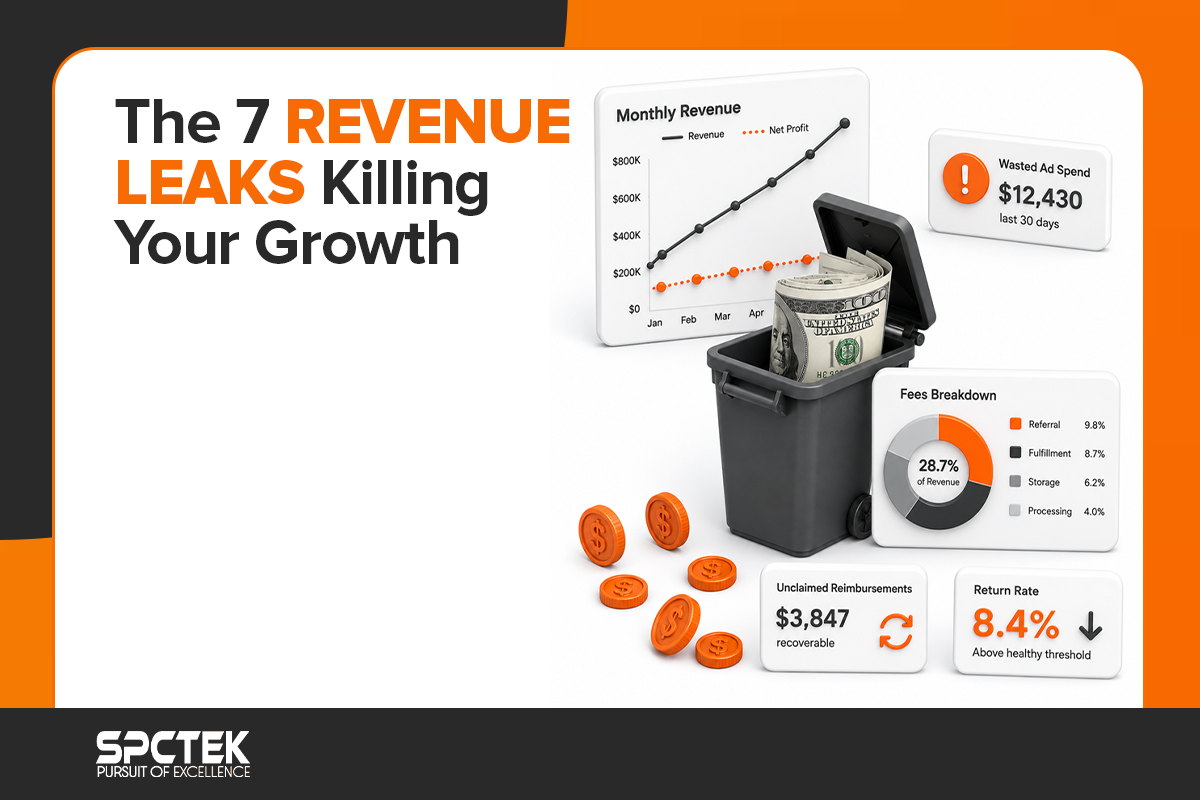
Your monthly revenue chart looks fine, and maybe it is even climbing a little. But something still feels stuck, like growth has hit a wall you can not quite point to. That feeling is usually revenue loss hiding in plain sight, a handful of small leaks running quietly at the same time.
This is one of the most common patterns among brands doing $200K to $500K a month. The business is real, the demand is real, and yet profit never seems to catch up with how hard the team is working. Most conversations about ecommerce revenue focus entirely on bringing in more sales, and almost never on whether the sales already happening are actually reaching the bank account intact. This guide breaks down the seven most common places that revenue loss happens, why they are so easy to miss, and what to do about each one.
What Is Revenue Leakage?
Revenue leakage is money that should have reached your business but never did, usually because something in the sales, fulfillment, or ad process quietly failed. It is different from loss in revenue caused by a slow season or a product that just is not selling. Leakage happens even when demand is healthy; the money is simply slipping out somewhere between the sale and the bank deposit.
Loss in revenue from a slow quarter is visible immediately, the sales number itself drops, and everyone notices. Leakage is the opposite kind of problem. Total sales can stay flat or even grow while a real amount of money quietly disappears underneath that number, which is exactly why it survives so long without anyone catching it.
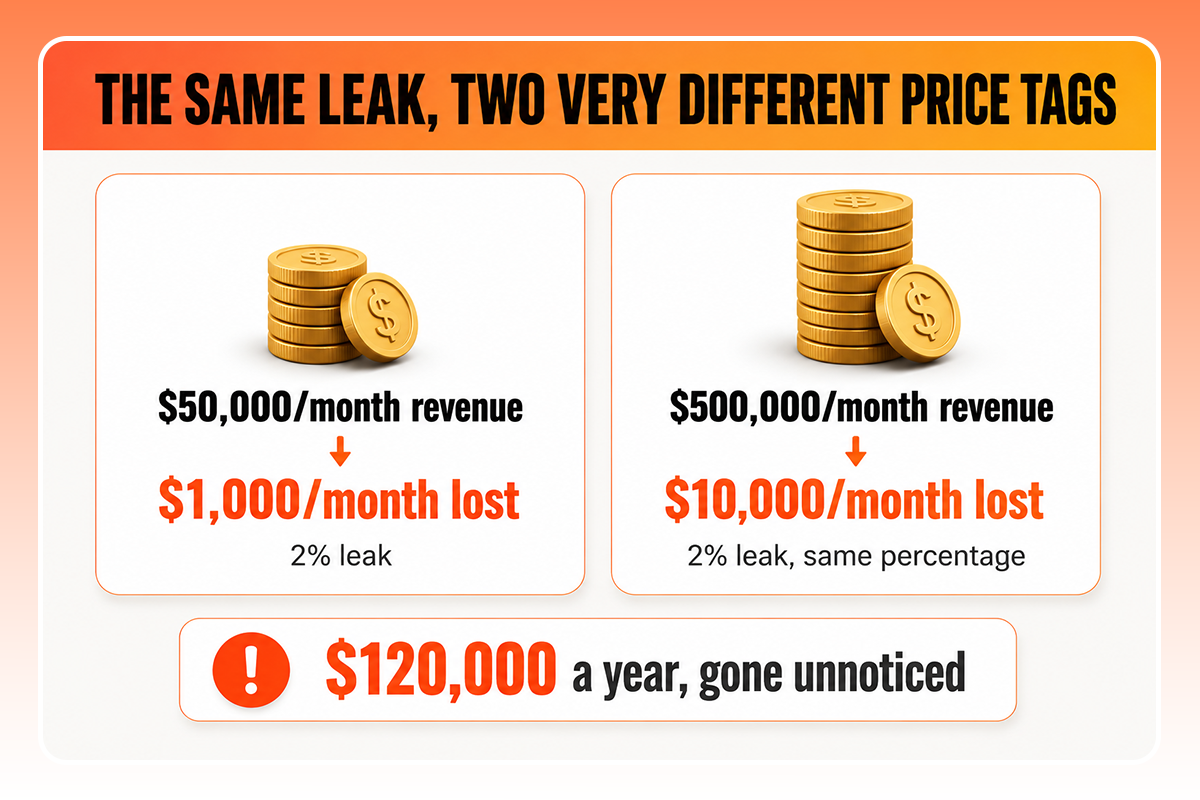
This is why leakage is so dangerous for growing brands specifically. A brand doing $50,000 a month might lose a small amount to a leak and barely notice. A brand doing $500,000 a month loses ten times as much from the exact same leak, and it is usually still invisible on the dashboard because total sales keep climbing anyway.
How Can You Identify Revenue Leakage in Your Sales Process?
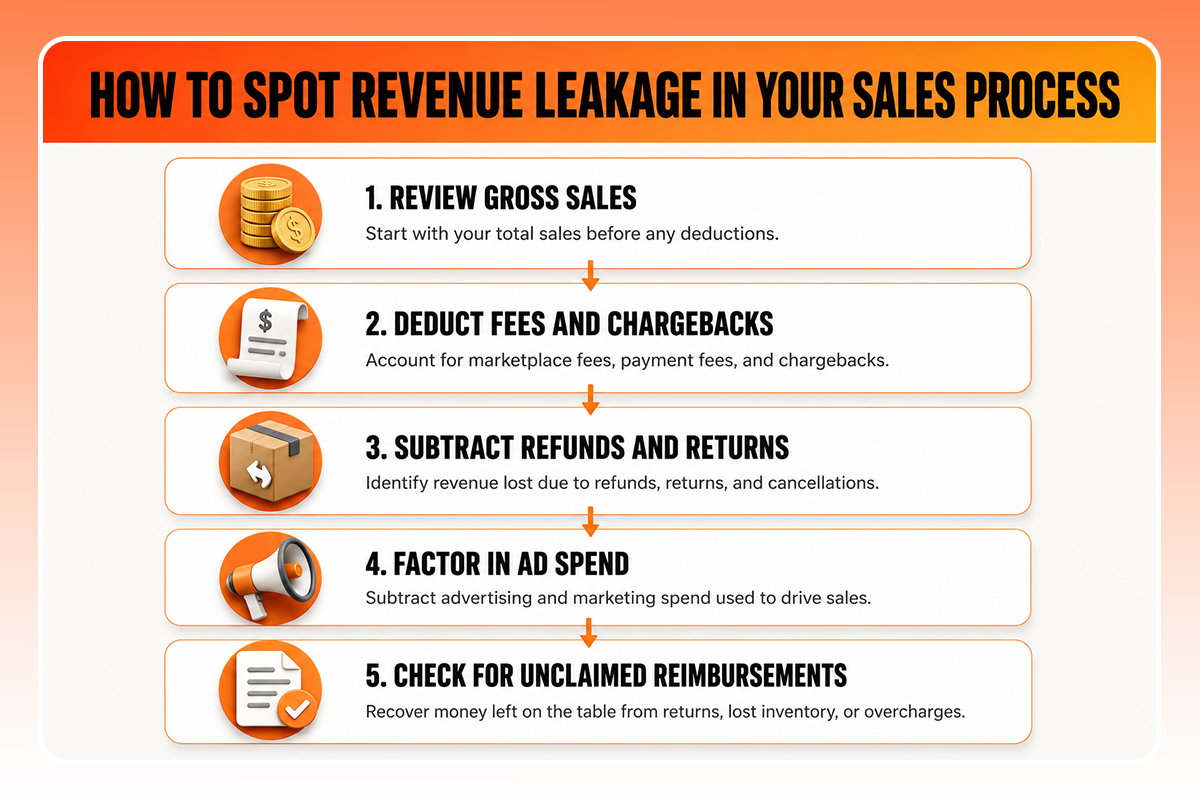
The fastest way to spot revenue leakage is comparing what you should have earned against what actually landed in your account for the same period, since most brands never run this comparison and instead trust one dashboard number that hides the gap. Here’s what actually goes into it. Whatever gap is left between that final number and your expected margin is where the revenue loss has been hiding.
- Gross sales for the period: your total sales number before anything gets subtracted.
- Every fee: marketplace referral, fulfillment, storage, or payment processing, whatever applies to your setup.
- Refunds and returns: including any shipping or restocking cost tied to them, not just the refund itself.
- Total ad spend: across every paid channel for that same period.
- Unclaimed reimbursements: anything owed to you from fulfillment programs that hasn’t been filed yet, added back in.
What Are the 7 Revenue Leaks Killing Growth Under $500K?
Most brands stuck under $500K a month leak revenue across seven quiet spots at once: wasted ad spend, bad cost tracking, hidden fees, stale listings, unclaimed reimbursements, single-channel risk, and untracked returns. None of these show up as one obvious red flag. They just compound quietly while total sales keep climbing.
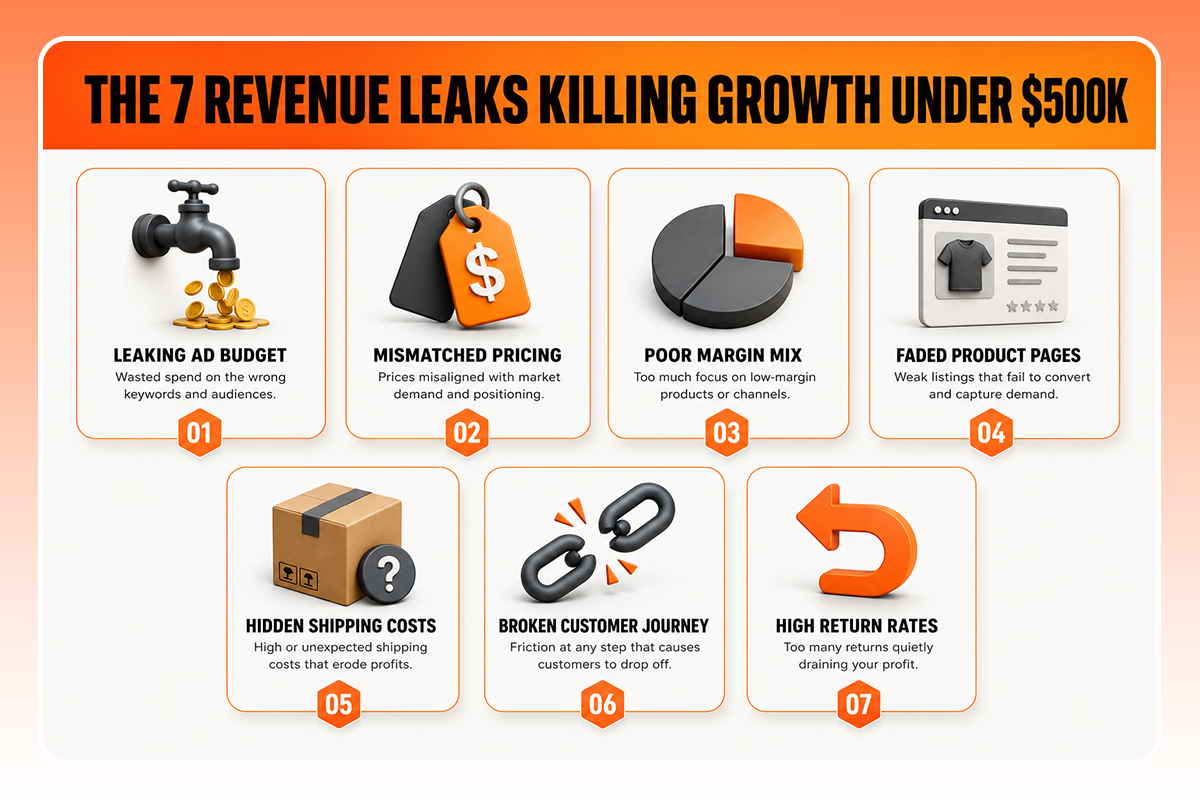
Here is where most of that revenue loss actually comes from.
1. Wasted Ad Spend Across Paid Channels
Ad spend climbs every quarter, but sales do not always climb with it. Bids get set once and left alone. Broad targeting keeps pulling budget toward audiences that were never going to convert. This happens on every paid channel, Amazon PPC, Meta, Google, not just one. If you are running ads on Amazon specifically, the 5 silent PPC leaks guide breaks down exactly where Amazon revenue loss tends to hide inside an ad account once it crosses this scale.
2. Untracked Cost of Goods and Landed Cost Errors
This is one of the largest and least visible leaks a brand can have. If your cost of goods numbers are wrong, everything built on top of them is wrong too: your pricing, your ad targets, your product-level profit. Common causes include using an old supplier price after a cost increase, forgetting to fold in shipping and duties, or never updating landed cost after a supplier change.
This single leak alone affects the majority of growing sellers according to profitability research, and it is one of the clearest revenue cycle management mistakes a brand can make since it corrupts every decision downstream. Fixing this revenue cycle management mistake usually just means setting a recurring monthly check on supplier pricing instead of updating costs only when someone happens to remember.
3. Fees Quietly Eating Margin
Referral fees, fulfillment fees, storage fees, payment processing fees, they all add up fast, and most brands know they exist without actually tracking what percentage of every sale they are taking. A brand selling on a marketplace faces referral and fulfillment fees, a common source of Amazon revenue loss that rarely gets tracked as its own line item. A brand running its own Shopify store faces payment processing and app subscription fees instead. Either way, margin quietly shrinks unless someone is watching the real percentage every month, not just glancing at the invoice.
4. Stale Product Pages Losing Organic Visibility
A product page that converted well a year ago can lose relevance without ever getting flagged as broken, because nothing about it technically changed. Search behavior shifts, competitors refresh their content, and a page that never gets revisited slowly falls behind. This forces more ad spend just to hold the same sales level. For Amazon sellers specifically, the mechanism behind this connects directly to why ROAS quietly drops even when sales still look fine, since a stale listing is often the real cause hiding behind what looks like an advertising problem.
5. Unclaimed Fulfillment Reimbursements
Inventory gets lost, damaged, or miscounted inside fulfillment networks more often than most sellers realize, whether that is Amazon FBA, Walmart WFS, or a third-party 3PL. Nearly every one of these programs owes sellers reimbursements for exactly this, and nearly every seller leaves a real amount of that money unclaimed simply because nobody is filing for it regularly.
6. Single-Channel Dependence
Single-channel risk shows up when one platform controls the majority of your revenue. Every fee increase, algorithm change, or policy shift lands directly on the business, with nowhere else to absorb it.
7. Return and Refund Leakage
Untracked return rates quietly cut into net revenue more than most brands assume. Industry data puts typical leakage from returns and refund handling at 2 to 4 percent of gross revenue for direct-to-consumer brands, rising to as much as 6 percent for brands selling across multiple channels. Refund rates climbing above roughly 8 percent often signal a deeper pattern worth investigating, not just normal customer behavior.
How Do These Leaks Compound at $500K a Month and Above?
Small percentage losses turn into real dollar amounts fast once monthly revenue gets into six figures. A 2 percent leak on $500,000 in monthly revenue works out to $10,000 a month, or $120,000 a year, gone before anyone even notices it is happening. That same 2 percent leak at $50,000 a month is only $1,000, easy to miss and easy to shrug off.
This is exactly why brands at this stage need to check for leaks on purpose instead of waiting to stumble onto one. To put this in perspective, average ecommerce revenue for most direct-to-consumer brands sits nowhere near the $500K/month range these leaks hit hardest, which is exactly why generic small-business advice about revenue leakage rarely accounts for how much bigger the dollar figures get once a brand reaches this stage. The bigger the business gets, the more expensive it becomes to keep ignoring the small stuff. Revenue growth at this stage depends just as much on plugging what is already leaking out as it does on bringing in new sales.
Which Companies Help With Ecommerce Sales Growth and Revenue Increase?
Here are some of the companies actively working in this space right now, along with what each one focuses on.
- SPCTEK: Turning growth into a system instead of a struggle, running full account reviews across PPC, listings, fees, channel dependency, and fulfillment reimbursements together. Built specifically for brands doing $200,000 to $500,000 a month who need all of these checked as one connected system rather than hiring separately for each piece.
- My Amazon Guy: A full-service Amazon agency built around growth hacking sales through traffic and conversion improvements, covering PPC, SEO, catalog, and brand launch work for sellers scaling on Amazon.
- Seller Interactive: one-stop shop covering any service needed to run an Amazon or Walmart business, from account management to creative and SEO.
- BellaVix: A full-service Amazon and Walmart marketing agency focused on helping brands increase sales and achieve category domination on marketplaces.
- SellerQI: Seller software rather than a full agency, auditing a full Amazon account every 24 hours to catch PPC waste, suppressed listings, and unclaimed FBA reimbursements automatically.
- Novadata: An analytics platform for Amazon sellers, agencies, and brands, tracking profit, PPC, and over 200 KPIs across marketplaces with SKU-level profit and loss detail.
The right fit usually depends on whether you need one specific leak fixed or a full audit across the whole business. A free Amazon Ads Performance Analyzer is a quick way to check if wasted ad spend is one of your leaks before deciding how much help you actually need.
What Is the Revenue Growth Formula?
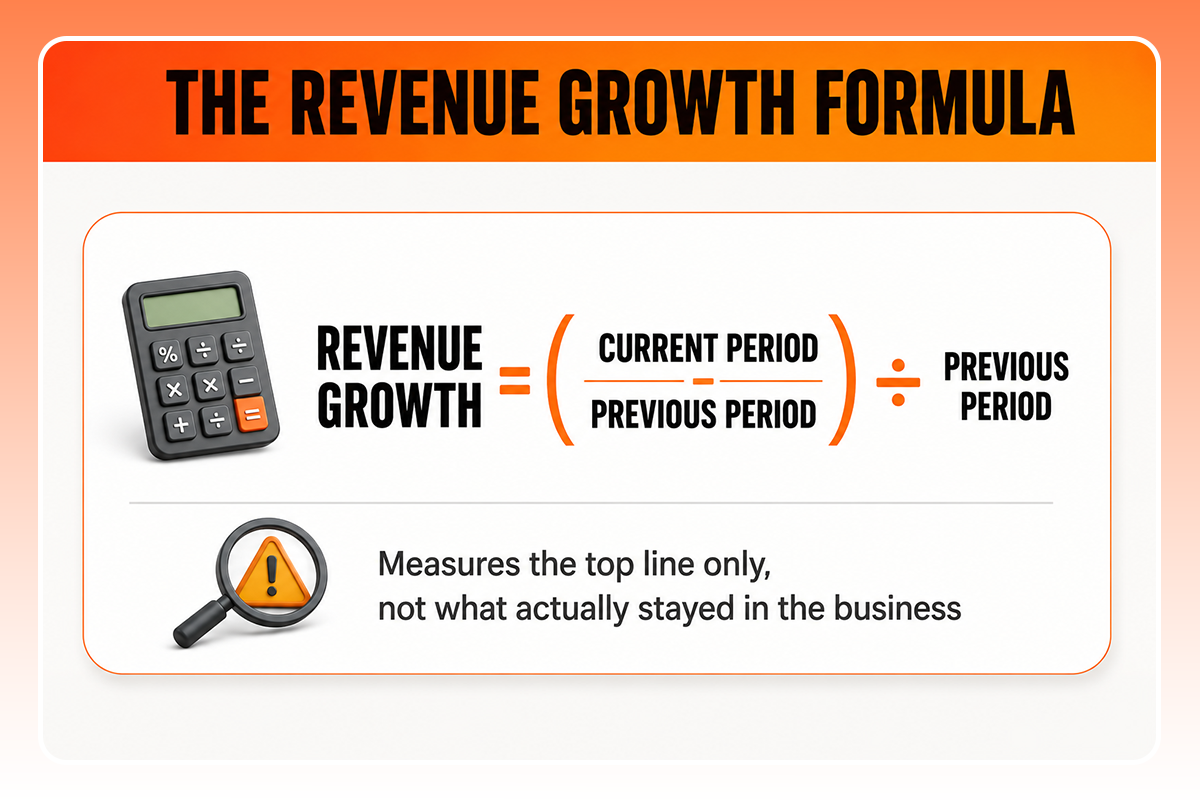
The revenue growth formula looks like this:
Revenue Growth = (Current Period Revenue − Previous Period Revenue) ÷ Previous Period Revenue
It shows how much your top line grew between two periods, nothing more. A brand can plug last year’s numbers into this revenue growth formula and see a healthy percentage while still leaking a meaningful amount of that same revenue underneath it, since the formula only measures the top line, not what actually stayed in the business.
Conclusion
None of these seven leaks require a bigger budget to fix. They require someone actually looking for them, which is easy to put off when total sales still look fine on the surface. A brand that finds and fixes even two or three of these leaks often unlocks more real profit than a month of aggressive new ad spend ever would.
The brands that actually break through $500K a month are rarely the ones with the biggest marketing budget. They’re the ones who stopped assuming their revenue was clean just because the sales chart kept climbing, and started checking the seven places money quietly slips out instead.